Comparative Study
. 2002 Oct;7(4):330-8.
doi: 10.1379/1466-1268(2002)007<0330:lidtca>2.0.co;2.

Lipid interaction differentiates the constitutive and stress-induced heat shock proteins Hsc70 and Hsp70

Affiliations
Comparative Study

Lipid interaction differentiates the constitutive and stress-induced heat shock proteins Hsc70 and Hsp70

Nelson Arispe et al. Cell Stress Chaperones. 2002 Oct.

Abstract

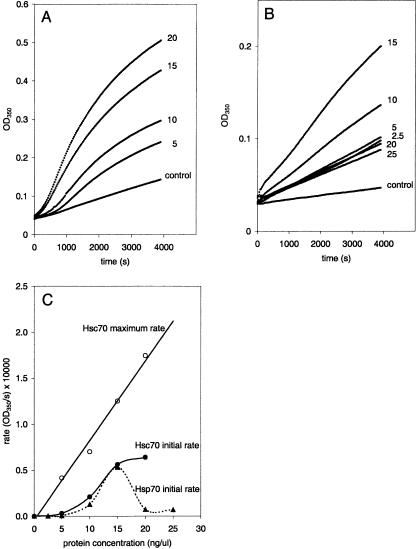
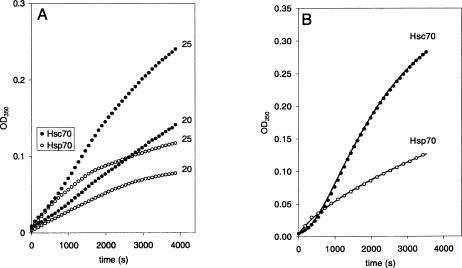
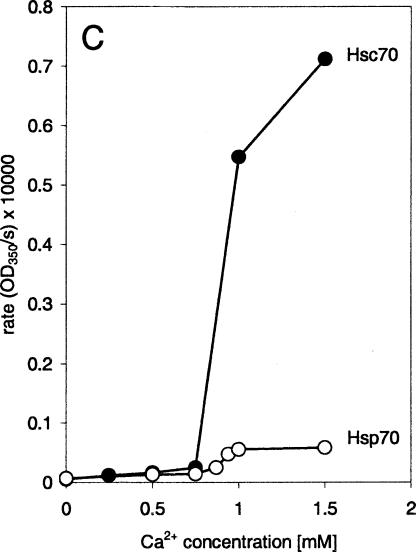
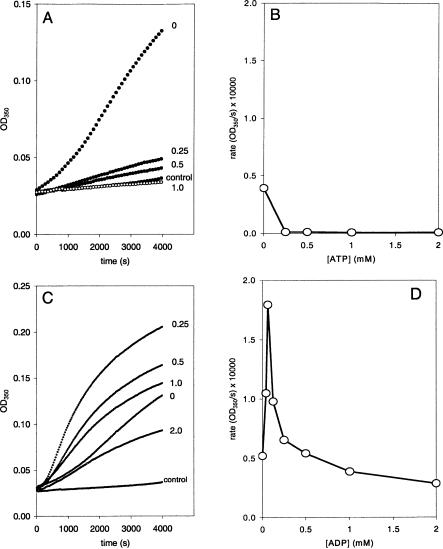
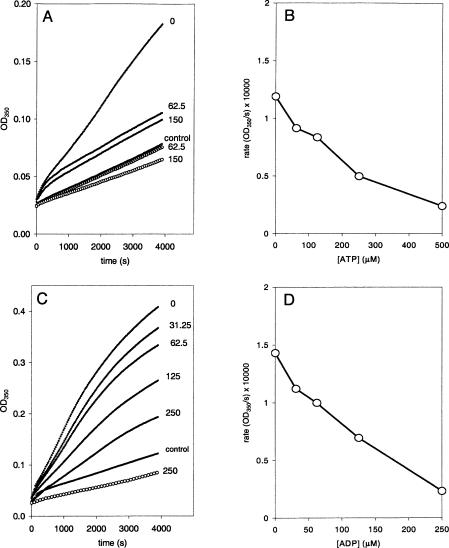
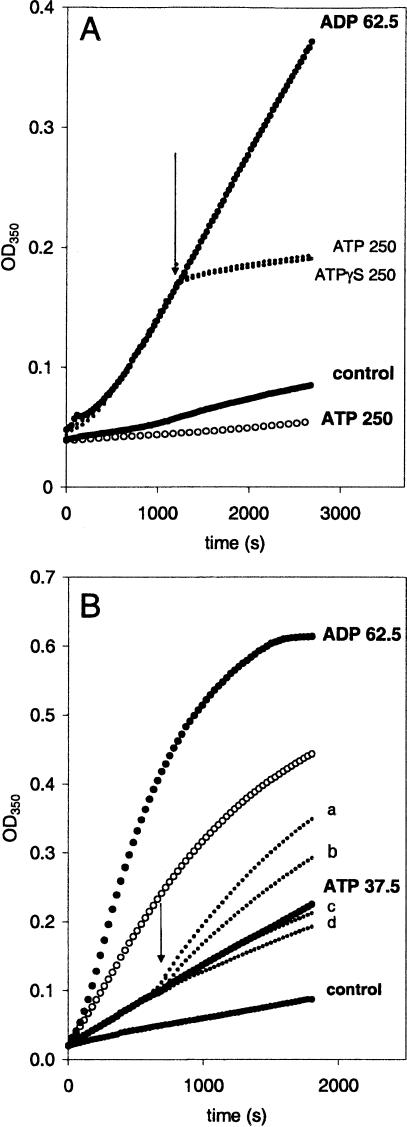
Heat shock proteins play a major role in the process of protein folding, and they have been termed molecular chaperones. Two members of the Hsp70 family, Hsc70 and Hsp70, have a high degree of sequence homology. But they differ in their expression pattern. Hsc70 is constitutively expressed, whereas Hsp70 is stress inducible. These 2 proteins are localized in the cytosol and the nucleus. In addition, they have also been observed in close proximity to cellular membranes. We have recently reported that Hsc70 is capable of interacting with a lipid bilayer forming ion-conductance channels. In the present study, we found that both Hsc70 and Hsp70 interact with lipids and can be differentiated by their characteristic induction of liposome aggregation. These proteins promote the aggregation of phosphatidylserine liposomes in a time- and protein concentration-dependent manner. Although both proteins are active in this process, the level and kinetics of aggregation are different between them. Calcium ions enhance Hsc70 and Hsp70 liposome aggregation, but the effect is more dramatic for Hsc70 than for Hsp70. Addition of adenosine triphosphate blocks liposome aggregation induced by both proteins. Adenosine diphosphate (ADP) also blocks Hsp70-mediated liposome aggregation. Micromolar concentrations of ADP enhance Hsc70-induced liposome aggregation, whereas at millimolar concentrations the nucleotide has an inhibitory effect. These results confirm those of previous studies indicating that the Hsp70 family can interact with lipids directly. It is possible that the interaction of Hsp70s with lipids may play a role in the folding of membrane proteins and the translocation of polypeptides across membranes.


Figures

Fig. 1.
Fig. 1.
Liposome aggregation induced by heat shock proteins (Hsps). (A) Time course of change in optical density (OD) due to aggregation of phosphatidylserine (PS) liposomes in the presence of different concentrations of Hsc70. (B) Time course of change in OD due to aggregation of PS liposomes in the presence of different concentrations of Hsp70. Values next to each curve indicate the protein concentration (ng/μL). The aggregation solution contained 1 mM CaCl2 and 0.5 mM MgCl2. To initiate the aggregation process, PS liposomes were added to the aggregation solution to a final concentration of 1 μg/μL. The OD change was measured every 30 seconds at 350 nm. (C) Rates of the OD change (OD/s) as a function of Hsc70 and Hsp70 concentrations. The initial rate (filled squares and circles) was calculated as the slope for the first 250 seconds of the aggregation reaction. The maximum rate values (empty circles) correspond to the maximum OD change per sampling period (30 seconds) value calculated over 1 hour of aggregation reaction
Fig. 2.
Fig. 2.
Differential liposome aggregation induced by Hsc70 and Hsp70. (A) Time course of optical density (OD) change due to aggregation of phosphatidylserine (PS) liposomes induced by Hsc70 (filled circles) and Hsp70 (empty circles) at 2 different concentrations (20 and 25 ng/μL). The reactions were simultaneously run under equal conditions to illustrate the higher capacity of Hsc70 to induce liposome aggregation. (B) Simultaneous measurements of the OD change generated by the aggregation of liposome induced by equal concentrations (10 ng/mL) of Hsc70 (filled circles) and Hsp70 (empty circles). The curves illustrate differences in the kinetics of the liposome aggregation. The solid lines represent the best fit to the points calculated using equations described in the text. For solid line on Hsc70 points: ΔODmax = 0.35, ODt = 0 = 0.0048, α = 1/1580 s−1. For solid line on Hsp70 points: ΔODmax,1 = 0.242, ΔODmax,2 = 0.012, ODt = 0 = 0.0046, α1 = 1/5800 s−1, α2 = 1/350 s−1
Fig. 3.
Fig. 3.
Effect of calcium on Hsc70- and Hsp70-induced liposome aggregation. Maximum rates of liposome aggregations induced by equal concentrations (10 ng/mL) of Hsc70 (filled circles) and Hsp70 (empty circles) as a function of the calcium concentration. The maximum rate values (empty circles) correspond to the maximum OD change per sampling period (30 seconds) value calculated over 1 hour of aggregation reaction
Fig. 4.
Fig. 4.
Effect of nucleotides on liposome aggregation induced by Hsc70. (A) Representative time course of the optical density (OD) change generated by liposome aggregation induced by Hsc70 (10 ng/μL) in the absence and the presence of 0.25 or 0.5 mM of adenosine triphosphate (ATP) (filled circles). The curve described by the empty circles corresponds to the time course of the liposome aggregation, in the absence of Hsc70 protein, generated by the sole addition of 1 mM ATP. (B) Maximum rates of the liposome aggregations induced by Hsc70 (10 ng/mL) as a function of the ATP concentration (average, n = 3). (C) Representative time course of the OD change generated by liposome aggregation induced by Hsc70 (10 ng/μL) in the absence and the presence of adenosine diphosphate (ADP). Numbers next to the curves indicate the ADP concentrations (mM). (D) Maximum rates of the liposome aggregations induced by Hsc70 (10 ng/mL) as a function of the ADP concentration (average, n = 5)
Fig. 5.
Fig. 5.
Effect of nucleotides on liposome aggregation induced by Hsp70. (A) Time course of the optical density (OD) change generated by liposome aggregation induced by Hsp70 (10 ng/μL) in the absence and the presence of 62.5 and 150 μM of adenosine triphosphate (ATP) (filled circles). The curves described by the empty circles correspond to the time course of the liposome aggregation, in the absence of Hsc70 protein, generated by the sole addition of 62.5 and 150 μM ATP. (B) Maximum rates of the liposome aggregations induced by of Hsp70 (10 ng/mL) as a function of the ATP concentration. (C) Time course of the OD change generated by liposome aggregation induced by Hsp70 (10 ng/μL) in the absence and the presence of adenosine diphosphate (ADP). The numbers next to the curves indicate the ADP concentrations (μM). The curve described by the empty circles corresponds to the time course of the liposome aggregation, in the absence of Hsp70 protein, generated by the sole addition of 250 μM of ADP. (D) Maximum rates of the liposome aggregations induced by Hsp70 (10 ng/mL) as a function of the ADP concentration
Fig. 6.
Fig. 6.
Competition between nucleotides on liposome aggregation induced by Hsc70. (A) Simultaneous recording of the time course of the optical density (OD) change in 3 reaction cells in which liposome aggregation was induced by Hsc70 (10 ng/μL) in the presence of 62.5 μM of adenosine diphosphate (ADP). After 20 minutes of liposome aggregation process, adenosine triphosphate (ATP) (250 μM) or a nonhydrolyzable analogue ATPγS (250 μM) was added (see arrow) to 2 of the cuvettes. Liposome aggregation in the presence of the same concentrations of ATP, but in the absence of Hsp70, was monitored simultaneously (empty circles). The control curve corresponds to the liposome aggregation observed in the absence of protein and nucleotides. (B) Time course of the OD change generated by liposome aggregation induced by Hsp70 (10 ng/μL) in the absence (empty circles) and the presence (filled circles) of nucleotides. ADP at concentrations of 62.5, 75, 100, and 200 μM (curves a, b, c, and d, respectively) was added 10 minutes after the initiation of the reaction (arrow) to 5 different cuvettes containing ATP (37.5 μM). The aggregation in 1 of the cuvettes (top curve) was performed in the presence of 62.5 μM ADP. The control (bottom curve) corresponds to the resulting liposome aggregation observed in the absence of protein and nucleotides

References

    1. Agashe VR, Hartl FU. Roles of molecular chaperones in cytoplasmic protein folding. Semin Cell Dev Biol. 2000;1(1):15–25. - PubMed
    1. Arispe N, De Maio A. ATP and ADP modulate a cation channel formed by Hsc70 in acid phospholipid membranes. J Biol Chem. 2000a;275:30839–30843. - PubMed
    1. Arispe N, De Maio A 2000b Differential liposome aggregation by two members of the heat shock 70 family of proteins. Biophys J. 78(1):36. A.
    1. Arispe N, Doh M, and De Maio A 2001 Extracellular interaction of the heat shock proteins Hsc70 and Hsp70 with PC12 cells leads to a reduction in viability [abstract]. Mol Biol Cell. 12:201. A. - PubMed
    1. Asea A, Kraeft SK, Kurt-Jones EA, Stevenson MA, Chen LB, Finberg RW, Koo GC, Caldewood SK. Hsp70 stimulates cytokine production through a CD 14-dependent pathway, demonstrating its dual role as a chaperone and cytokine. Nat Med. 2000;6:435–442. - PubMed

Publication types

MeSH terms

LinkOut - more resources