. 2003 Apr 1;31(7):1962-8.
doi: 10.1093/nar/gkg283.

Absolute mRNA concentrations from sequence-specific calibration of oligonucleotide arrays

Affiliations

Absolute mRNA concentrations from sequence-specific calibration of oligonucleotide arrays

Doeke Hekstra et al. Nucleic Acids Res. .

Abstract

Oligonucleotide microarrays are based on the hybridization of labeled mRNA molecules to short length oligonucleotide probes on a glass surface. Two effects have been shown to affect the raw data: the sequence dependence of the probe hybridization properties and the chemical saturation resulting from surface adsorption processes. We address both issues simultaneously using a physically motivated hybridization model. Based on publicly available calibration data sets, we show that Langmuir adsorption accurately describes GeneChip hybridization, with model parameters that we predict from the sequence composition of the probes. Because these parameters have physical units, we are able to estimate absolute mRNA concentrations in picomolar. Additionally, by accounting for chemical saturation, we substantially reduce the compressive bias of differential expression estimates that normally occurs toward high concentrations.


Figures

Figure 1
Figure 1
Langmuir isotherms provide a very accurate description of GeneChip hybridization. After each probe has been fitted to the form I = ax / (b + x) + d, the rescaled variables X = x / b and Y = (Id) / a collapse onto the form Y = X / (1 + X). Notice the range on the x-axis covers six orders of magnitude. The significant density of points near the shoulders indicates that saturation is not a marginal effect. Specifically, 69% of all PM probes have b < 512 pM. For these, at least 2 out of the 14 measurements lie above X = 1. The total fraction of measurements above X = 1 (respectively X = 0.5) is 20% (respectively 28%). The MM case is only slightly noisier. All probes with a, b, Y > 0 were plotted representing 94% of all probes for the PM (5472 out of 5824 measurements with positive target RNA concentration), and 87% in the MM case.
Figure 2
Figure 2
Comparison of the Langmuir parameters a (A), b (B) and d (C) for the PM and MM probes. The line in (B) corresponds to bMM = 3.13 bPM.
Figure 3
Figure 3
Data from Tables 1 and 2. The sign flip in the contribution from letter A to ln(d) as compared to ln(a) and ln(b) is particularly obvious.
Figure 4
Figure 4
Absolute concentration estimates: no scale adjustments were made. (A) We tested generalization by using 11 out of 14 transcripts for fitting the parameters γ, then used these parameters to predict the concentrations of the other three. Here, we picked the first three transcripts (according to alphabetically sorted Affymetrix labels) and show predicted versus real concentrations in pM for the two duplicated experiments 1521 and 1532. (B) We tested all transcripts; no probe sets were excluded for determining the γs. The dots represent first quartile, median and third quartile of the 28 measurements (14 transcripts in duplicate). Full box plots are shown in the Supplementary Material.
Figure 5
Figure 5
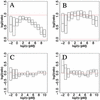
Differential expression scores for expected ratios of 2 and 1 (no change). Results for ratios of 2 are shown in (A) and (B); control of false positive rates in (C) and (D). (A) and (C) were obtained from MAS 5.0; (B) and (D) from our own estimates using only the PM probes. The compressive bias is clearly visible in (A) as the median ratio lies systematically below the expected value indicated by the upper red line. (B) shows how much our method is capable of reducing bias; sensitivity is also improved despite increased noise levels (Table 3). Low intensity results in (C) and (D) suggest that the normalization is not ideal. For the results in (B), more than half the probes were kept in 85.4% of the comparisons, and more than 12 probes (out of 16) were retained in 333 out of 336 cases. Full box plots are shown in the Supplementary Material.

References

    1. Chee M., Yang,R., Hubbell,E., Berno,A., Huang,X.C., Stern,D., Winkler,J., Lockhart,D.J., Morris,M.S. and Fodor,S.P. (1996) Accessing genetic information with high-density DNA arrays. Science, 274, 610–614. - PubMed
    1. Chudin E., Walker,R., Kosaka,A., Wu,S.X., Rabert,D., Chang,T.K. and Kreder,D.E. (2002) Assessment of the relationship between signal intensities and transcript concentration for Affymetrix GeneChip arrays. Genome Biol., 3, RESEARCH0005. - PMC - PubMed
    1. Naef F., Socci,N. and Magnasco,M. (2002) A study of accuracy and precision in oligonucleotide arrays: extracting more signal at large concentrations. Bioinformatics, 19, 178–184. - PubMed
    1. Naef F., Lim,D.A., Patil,N. and Magnasco,M. (2002) DNA hybridization to mismatched templates: a chip study. Phys. Rev. E Stat. Nonlin. Soft Matter Phys., 65, 040902. - PubMed
    1. Dai H., Meyer,M., Stepaniants,S., Ziman,M. and Stoughton,R. (2002) Use of hybridization kinetics for differentiating specific from non-specific binding to oligonucleotide microarrays. Nucleic Acids Res., 30, e86. - PMC - PubMed

MeSH terms