. 2003 Apr 1;31(7):e35.
doi: 10.1093/nar/gng035.

Light-directed 5'-->3' synthesis of complex oligonucleotide microarrays

Affiliations

Light-directed 5'-->3' synthesis of complex oligonucleotide microarrays

Thomas J Albert et al. Nucleic Acids Res. .

Abstract

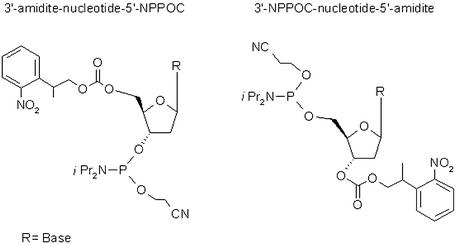
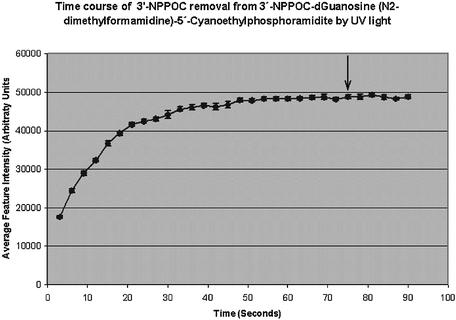
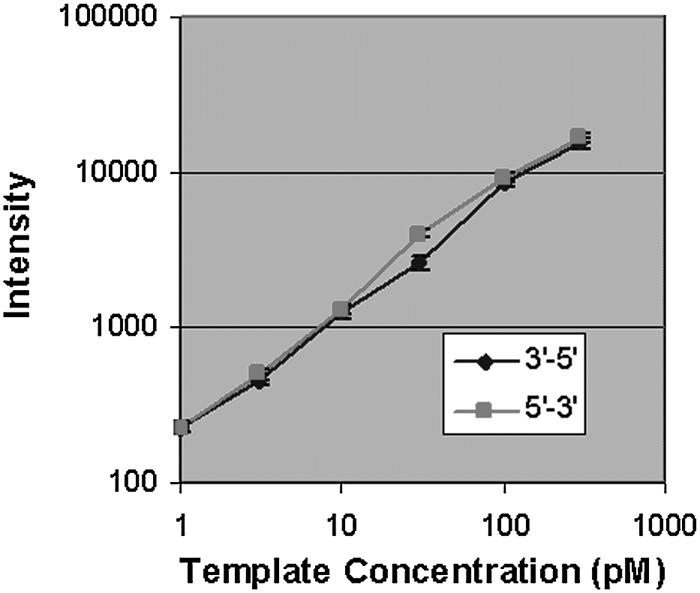
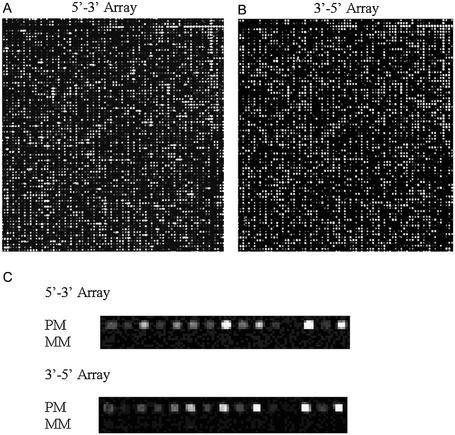
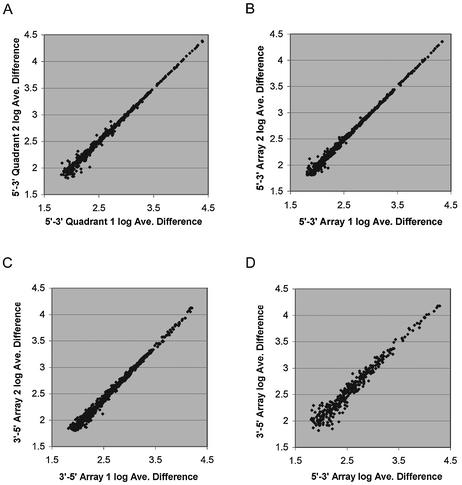
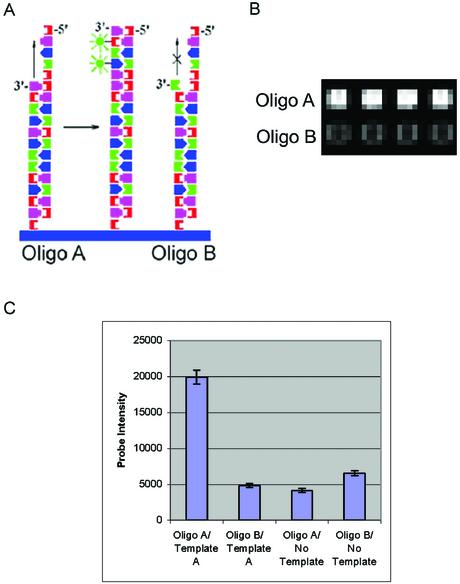
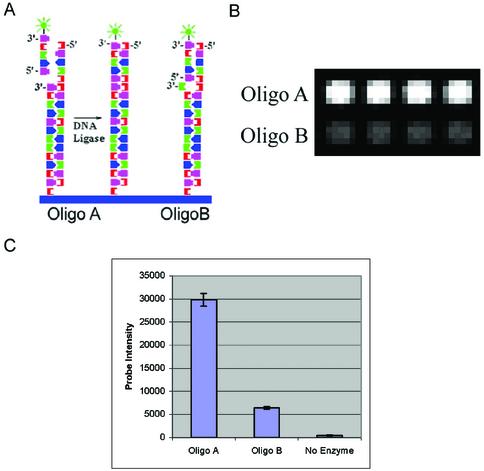
Light-directed synthesis of high-density microarrays is currently performed in the 3'-->5' direction due to constraints in existing synthesis chemistry. This results in the probes being unavailable for many common types of enzymatic modification. Arrays that are synthesized in the 5'-->3' direction could be utilized to perform parallel genotyping and resequencing directly on the array surface, dramatically increasing the throughput and reducing the cost relative to existing techniques. In this report we demonstrate the use of photoprotected phosphoramidite monomers for light-directed array synthesis in the 5'-->3' direction, using maskless array synthesis technology. These arrays have a dynamic range of >2.5 orders of magnitude, sensitivity below 1 pM and a coefficient of variance of <10% across the array surface. Arrays containing >150,000 probe sequences were hybridized to labeled mouse cRNA producing highly concordant data (average R(2) = 0.998). We have also shown that the 3' ends of array probes are available for sequence-specific primer extension and ligation reactions.


Figures

Figure 1
Figure 1
Structures of monomers used for 3′→5′ and 5′→3′ array synthesis.
Figure 2
Figure 2
Time course of 3′-NPPOC removal by UV light. Arrays were synthesized with one 3′-NPPOC protected phosphoramidite base layer coupled to the silanized slide. These arrays were then dosed with increasing amounts of UV light to remove the 3′-NPPOC protecting group from the array surface. The deprotected bases were then coupled to a Cy3-phosphoramidite to determine the time required for complete NPPOC removal. The graph indicates the average intensities of 10 array features plotted against the time of UV light exposure for guanosine. Error bars indicate the standard deviation of each measurement. The UV light intensity was 100 mW/cm2. The time point indicated by the arrow, 75 s, was used to calculate the energy required to completely remove the 3′-NPPOC group, 7.5 J/cm2.
Figure 3
Figure 3
Dynamic range and sensitivity. Six 24mer probes sequences were synthesized at 20 locations across the array surface. Two separate arrays were synthesized, one in the 5′→3′ direction, one in the 3′→5′ direction. The array probes were hybridized to six complementary Cy3-labeled oligonucleotides ranging from 300 to 1 pM. The graph represents the average raw intensity values of all array features for each probe on one array. The error bars represent the standard deviation for each probe across the array surface. The average coefficient of variance measurement for each probe is <10% for both synthesis directions. The average intensity values of the lowest concentration point, 1 pM, is more than four times above background levels for all arrays.
Figure 4
Figure 4
Detail of 5′→3′ and 3′→5′ array images. Arrays were designed with twenty 24mer probe pairs (perfect match and corresponding mismatch controls) per gene for 950 mouse genes. Probes were randomly distributed across one array quadrant, and each quadrant was repeated four times on each array. (A) Detail of an array synthesized in the 3′→5′ direction. (B) Detail of an array synthesized in the 5′→3′ direction. (C) Detail comparing perfect match and mismatch probes pairs for 5′→3′ synthesis and 3′→5′ synthesis. Arrays were scanned at a PMT gain of 450.
Figure 5
Figure 5
Intra-array and inter-array reproducibility. Three arrays were synthesized in the 5′→3′ direction and three were synthesized in the 3′→5′ direction. Arrays were hybridized with labeled mouse spleen cRNA. Average difference values were calculated for all genes represented on the array, and 620 genes with average difference values above the array background were used in the analysis. (A) Comparison of the average difference value for one quadrant with another quadrant of the same array synthesized in the 5′→3′ direction. (B and C) Comparison of the average difference values from the same quadrant on two separate arrays synthesized (B) 5′→3′ and (C) 3′→5′. (D) Comparison of the average difference values from the same quadrant from a 5′→3′ synthesized array with a 3′→5′ synthesized array.
Figure 6
Figure 6
Sequence-specific primer extension reactions. Arrays were synthesized with alternating rows of oligonucleotide sequences designated oligo A (5′-AGG TCA TTA CAG CGA GAG-3′) and oligo B (5′-AGG TCA TTA CAG CGA GAC-3′), which are identical except for the 3′ nucleotide. (A) Primer extension scheme showing hybridization of template A (5′-TGA CCT ATA ATC CTC TCG CTG TAA TGA CCT-3′) to the two array oligos. Klenow DNA polymerase is used to extend the 3′ end of the array oligos, and during the extension, labeled nucleotides are covalently attached to the array surface. Oligo A should extend with greater efficiency than oligo B, due to the 3′ mismatch in oligo B with template A. (B) Detail showing signal generated from oligo A and oligo B extended with template A. The array was scanned at a PMT gain of 520. (C) Intensity values resulting from primer extension of oligo A and oligo B with template A or no template.
Figure 7
Figure 7
Sequence-specific ligation reactions. (A) Ligation scheme showing template A hybridized to the array oligos A and B and ligation of the labeled ligation oligo (5′-phosphate-GATTATAGGTCA-Cy3-3′) to the end of the array oligos with DNA ligase. Ligation to oligo A should be more efficient than oligo B. (B) Detail showing signal generated from oligo A and oligo B after ligation. The array was scanned at a PMT gain of 600. (C) Intensity values resulting from ligation of the ligation oligo to oligo A and oligo B and signal from a no enzyme control. The no enzyme control indicates signal is covalently attached to the surface, and is not due to hybridization. Data points for both reaction types represent the average intensity of 50 array features, and error bars represent the standard deviation of the intensities from the same features.

References

    1. Gerhold D., Rushmore,T. and Caskey,C.T. (1999) DNA chips: promising toys have become powerful tools. Trends Biochem. Sci., 24, 168–173. - PubMed
    1. Irving P., Troxler,L., Heuer,T.S., Belvin,M., Kopczynski,C., Reichhart,J.-M., Hoffmann,J.A. and Hetru,C. (2001) A genome-wide analysis of immune responses in Drosphila. Proc. Natl Acad. Sci. USA, 98, 15119–15124. - PMC - PubMed
    1. Wang D.G., Fan,J.-B., Siao,C.-J., Berno,A., Young,P., Sapolsky,R., Ghandour,G., Perkins,N., Winchester,E., Spencer,J. et al. (1998) Large-scale identification, mapping and genotyping of single nucleotide polymorphisms in the human genome. Science, 280, 1077–1082. - PubMed
    1. Pastinen T., Raitio,M., Lindroos,K., Tainola,P., Peltonen,L. and Syvanen,A.-C. (2000) A system for specific, high-throughput genotyping by allele-specific primer extension on microarrays. Genome Res., 10, 1031–1042. - PMC - PubMed
    1. Hacia J.G., Fan,J.-B., Ryder,O., Jin,L., Edgemon,K., Ghandour,G., Mayer,R.A., Sun,B., Hsie,L., Robbins,C.M. et al. (1999) Determination of ancestral alleles for human single nucleotide polymorphisms using high density arrays. Nature Genet., 22, 164–167. - PubMed

MeSH terms

Substances