. 2003 Apr 1;100(7):4239-44.
doi: 10.1073/pnas.0635075100. Epub 2003 Mar 24.

Context sensitivity of activity-dependent increases in cerebral blood flow

Affiliations

Context sensitivity of activity-dependent increases in cerebral blood flow

Kirsten Caesar et al. Proc Natl Acad Sci U S A. .

Abstract

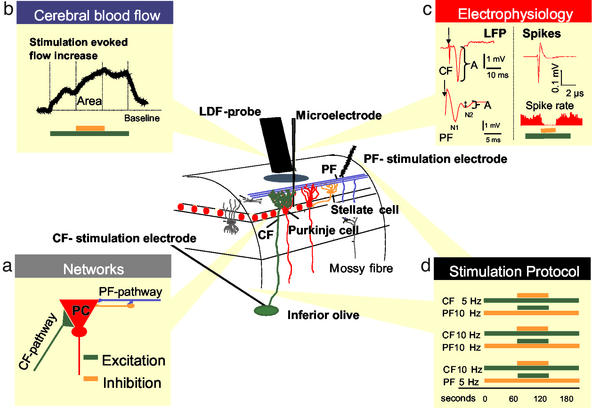
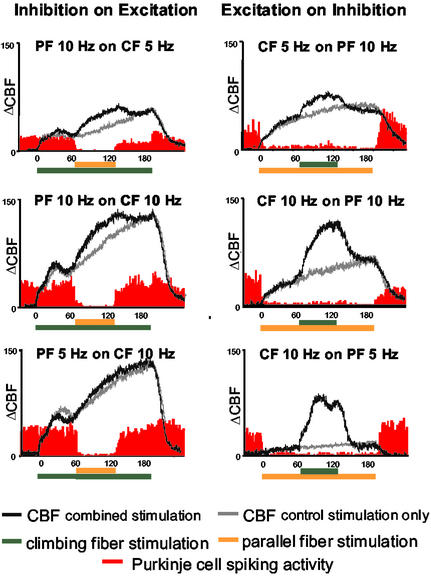
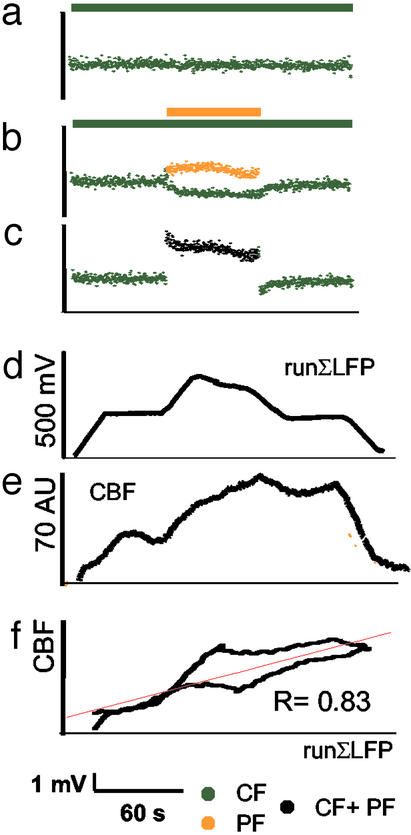
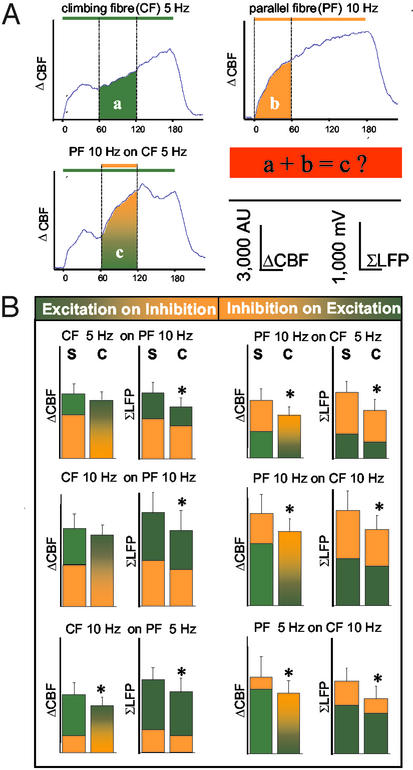
Functional neuroimaging in humans is used widely to study brain function in relation to human disease and cognition. The neural basis of neuroimaging signals is probably synaptic activity, but the effect of context, defined as the interaction between synaptic inhibition, excitation, and the electroresponsive properties of the targeted neurons, is not well understood. We examined here the effect of interaction of synaptic excitation and net inhibition on the relationship between electrical activity and vascular signals in the cerebellar cortex. We show that stimulation of the net inhibitory parallel fibers simultaneously with stimulation of the excitatory climbing fibers leads to a further rise in total local field potentials (LFP) and cerebral blood flow (CBF) amplitudes, not a decrease, as predicted from theoretical studies. However, the combined stimulation of the parallel and climbing fiber systems produced changes in CBF and LFP that were smaller than their algebraic sum evoked by separate stimulation of either system. This finding was independent of the starting condition, i.e., whether inhibition was superimposed on a state of excitation or vice versa. The attenuation of the increases in LFP and CBF amplitudes was similar, suggesting that synaptic activity and CBF were coupled under these conditions. The result might be explained by a relative neuronal refractoriness that relates to the intrinsic membrane properties of Purkinje cells, which determine the recovery time of these cells. Our work implies that neuronal and vascular signals are context-sensitive and that their amplitudes are modulated by the electroresponsive properties of the targeted neurons.


Figures

Figure 1
Figure 1
Recording of spikes, LFPs, and blood flow in the cerebellar cortex. At the center is a schematic, three-dimensional drawing of the experimental set-up, including neurons of interest and placement of LDF probe and stimulating and recording electrodes. Color coding has been used to depict circuits and cell types: granule cell axons (PF) are blue, the Purkinje cell bodies and dendrites are red, stellate cells are yellow, Golgi and basket cells are dark gray, and CF are green. Bipolar stimulation at the cerebellar surface activates the superficial PF that modulate Purkinje cell activity via interaction with Purkinje cells and stellate cells. A monopolar electrode placed stereotaxically in the caudal part of the inferior olive stimulated CF that give a monosynaptic excitatory input to Purkinje cells. Field potentials and single-unit spike activity were recorded by a glass microelectrode. CBF was recorded by LDF by using a probe that was located 0.3–0.5 mm above the pial surface. (a) Functional connectivity of the two afferent pathways to the Purkinje cell (PC), representing excitatory (CF) and net inhibitory (PF) synaptic input. CFs terminate on proximal dendrites of Purkinje cells. The net effect of CF stimulation is synaptic excitation and production of complex spikes in PC. The PFs terminate in the distal dendrites of the Purkinje cells and on the inhibitory interneurons. The random activity in these fibers, produced by the mossy fiber input to the cerebellar granule cells, drives the spiking activity of Purkinje cells under control conditions. The net effect of synchronized electrical stimulation of PF on the cerebellar surface is abolition of Purkinje cell-spiking activity due to synaptic inhibition. In all of the following graphs, CBF changes evoked by CF stimulation are depicted in green and those evoked by PF are orange. (b) Original LDF recording of an evoked CBF increase (colored bars indicate stimulation period) compared with baseline (dotted line). Area marks the increase due to combined stimulation of CF (green) and PF (orange). (c) Typical examples of LFPs evoked by CF and PF stimulation. Arrowheads mark stimulus onset. Baseline and peak values were used to calculate the LFP amplitude (A). In the PF recording, N1 indicates the presynaptic action potential in the PF and N2 indicates the postsynaptic potential produced by the Purkinje cells. (c Right) A typical example of an extracellular recording of Purkinje cell spontaneous simple spike, as well as of spike rate during combined stimulation (colored bars). (d) Protocols of all stimulation combinations and frequencies; CF stimulation is excitation (green bar) and PF stimulation is net inhibition (orange bar).
Figure 2
Figure 2
Effect of interaction of combined PF and CF stimulation on CBF and Purkinje cell-spiking activity. Average of original recordings of Purkinje cell-spiking activity and CBF for each stimulation protocol is shown. Colored horizontal bars indicate stimulation periods. In each plot, the gray trace indicates CBF for control conditions in which the PF (Left) or CF (Right) was stimulated alone for 180 s. The black trace indicates CBF for the combined stimulation. PF stimulation inhibited spiking activity when applied alone and in combination with excitation (CF) and independently of the sequence of the stimulation protocols. In contrast to Purkinje cell spiking, CBF increased further in response to combined combination.
Figure 3
Figure 3
Temporal coupling between increases in synaptic activity and in CBF under conditions of combined stimulation. The figure shows the averaged data for animals that were exposed to CF stimulation at 5 Hz for 180 s, with PF stimulation at 10 Hz superimposed during the middle 60 s. (a) Mean amplitudes of individual LFPs evoked by CF stimulation at 5 Hz alone over 180 s. (b) The LFP amplitude for CF stimulation decreased (green) when the mixed excitatory–inhibitory stimulus (PF) was superimposed. PF stimulation evoked postsynaptic LFPs from Purkinje cells that are shown in orange. (c) The algebraic sum of LFP amplitudes during combined stimulation of PF and CF increased. This indicated the overall increase in synaptic activity during stimulus combination (black). (d) Electrophysiological data were transformed to CBF signals by plotting a runΣLFP for a time window of 20 s vs. time. The waveform of the runΣLFP data was comparable to the CBF trace depicted in e. (f) Correlation of runΣLFP (data from d) vs. the evoked CBF increase (data from e) for the combined stimulation (R = correlation coefficient; P < 0.001). The lower part of the graph indicates the coupling between runΣLFP and CBF during stimulation, and the upper graph shows the coupling during return to baseline of the CBF response, i.e., after stop of stimulation. The red line indicates the result of the linear regression analysis.
Figure 4
Figure 4
Effect of interaction of two neuronal circuits on the evoked neuronal activity and CBF. (A) Examples of traces that were used to calculate whether the rise in CBF that was produced by combined stimulation was the same as the algebraic sum of CBF increments evoked by stimulation of either pathway alone. The illustration is based on averaged traces from all animals in which PF stimulation at 10 Hz was superimposed on CF stimulation at 5 Hz. The experiments tested the hypothesis that the algebraic sum of CBF increases evoked by stimulation of CF or PF alone (a and b) was the same as for combined stimulation (c). (B) The mean value of the algebraic sum of CBF for stimulation of the two pathways separately (S) compared with the mean increase in CBF recorded during combined stimulation (C). The graphs show that S was larger than C for all frequency combinations. The summed synaptic activity as indicated by ΣLFP was calculated for the same time periods as CBF and is shown for comparison. The decline in ΣLFP and CBF was similar, suggesting that the difference between the calculated and the observed rises in CBF was explained by changes in postsynaptic activity. All values are mean ± SEM; *, P < 0.05.

Comment in

References

    1. Lassen N A, Ingvar D H, Skinhoj E. Sci Am. 1978;239:62–71. - PubMed
    1. Sokoloff L. Fed Proc. 1981;40:2311–2316. - PubMed
    1. Ogawa S, Lee T M, Kay A R, Tank D W. Proc Natl Acad Sci USA. 1990;87:9868–9872. - PMC - PubMed
    1. Raichle M E. Proc Natl Acad Sci USA. 1998;95:765–772. - PMC - PubMed
    1. Buxton R B, Frank L R. J Cereb Blood Flow Metab. 1997;17:64–72. - PubMed

Publication types

LinkOut - more resources