. 2003 Apr;52(2):77-89.
doi: 10.1002/cyto.a.10028.

Fluorescence lifetime-resolved pH imaging of living cells

Affiliations

Fluorescence lifetime-resolved pH imaging of living cells

Hai-Jui Lin et al. Cytometry A. 2003 Apr.

Abstract

Background: The regulation and maintenance of intracellular pH are critical to diverse metabolic functions of the living cells. Fluorescence time-resolved techniques and instrumentations have advanced rapidly and enabled the imaging of intracellular pH based on the fluorescence lifetimes.

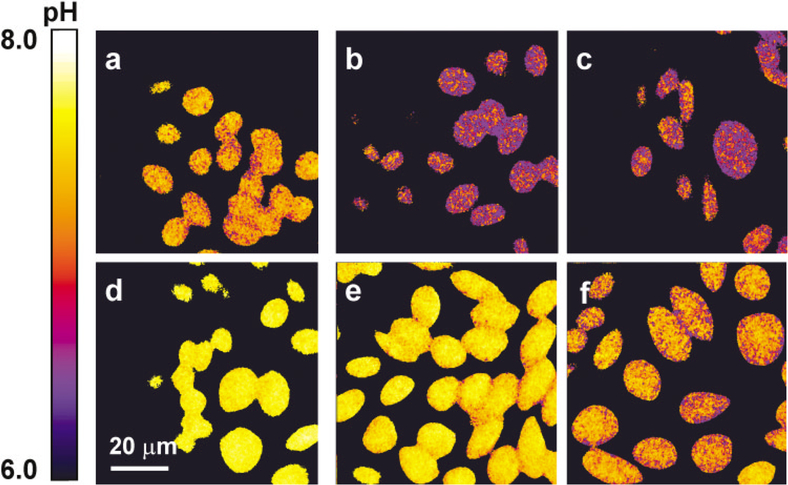
Methods: The frequency-domain fluorescence lifetime imaging microscopy (FLIM) and fluorophores displaying appropriate pH-dependent lifetime sensitivities were used to determine the temporal and spatial pH distributions in the cytosol and vesicular compartment lysosomes.

Results: We found that cytosolic pH levels are different in 3T3 fibroblasts, Chinese hamster ovary (CHO) cells, and MCF-7 cells when using the pH probe carboxy-SNAFL2. We also tracked the transient cytosolic pH changes in the living CHO cells after treatments with proton pump inhibitors, ion exchanger inhibitors, and weak base and acid. The intracellular lysosomal pH was determined with the acidic lifetime probes DM-NERF dextrans, OG-514 carboxylic acid dextrans, and LysoSensor DND-160. Our results showed that the resting lysosomal pH value obtained from the 3T3 fibroblasts was between 4.5 and 4.9. The increase of lysosomal pH induced by the treatments with proton pump inhibitor and ionophores also were observed in our FLIM measurements.

Conclusions: Our lifetime-based pH imaging data suggested that FLIM can measure the intracellular pH of the resting cells and follow the pH fluctuations inside the cells after environmental perturbations. To improve the z-axis resolution to the intracellular lifetime-resolved images, we are investigating the implementation of the pseudo-confocal capability to our current FLIM apparatus.


Figures

FIG. 1.
FIG. 1.
Schematic diagram of the fluorescence lifetime imaging microscopy instrumentations. CCD, charged coupled device; MCP, microchannel plate photomultiplier; ND, neutral density.
FIG. 2.
FIG. 2.
Intensity images (top) and corresponding modulation images (bottom) of living fibroblasts stained with carboxy-SNAFL2. The cytosolic pH values were clamped at pH 6.60, 7.30, and 7.80 individually with the high K+/nigericin method.
FIG. 3.
FIG. 3.
The in vitro pH-dependent emission spectra of carboxy-SNAFL2 and its pH-dependent modulation responsive curves (in vivo and in vitro) obtained at the red emission region (635 ± 25 nm).
FIG. 4.
FIG. 4.
Different adherent cell lines display different levels of cytosolic pH. The average cytosolic pH values were 7.40 for 3T3 cells (a), 7.20 for Chinese hamster ovary cells (b), and 7.15 for MCF-7 cells (c).
FIG. 5.
FIG. 5.
a–d: Time course of cytosolic pH fluctuations in Chinese hamster ovary cells after different manipulation steps. BA, bovine albumin; HBSS, Hank’s balanced salt solution.
FIG. 6.
FIG. 6.
Treatments of ionophores and weak bases perturb cytosolic pH levels of Chinese hamster ovary (CHO) cells. a: CHO cells were bathed in the NMG+ solution. b: Nigericin was added to the solution and incubated with CHO cells for 5 min. c: Nigericin was scavenged after the addition of bovine albumin, to 5 mg/ml. Incubation of CHO cells with 20 mM NH3/NH4+ for 2 (d) and 10 (e) min. f: CHO cells were rinsed and incubated with Hank’s balanced salt solution for 20 min.
FIG. 7.
FIG. 7.
In vitro pH-dependent spectral shifts and lifetime responsive curves of DND-160 and the intensity and pH images of a DND-160–stained 3T3 fibroblast.
FIG. 8.
FIG. 8.
Intensity images (top) and corresponding modulation images (bottom) of living 3T3 fibroblasts loaded with DM-NERF dextrans. In the presence of monensin and nigericin, lysosomal pH levels of cells were adjusted to the pH values of the incubation 2-(N-morpholino ethane sulfonic acid buffers: 4.40, 4.90, and 5.50.
FIG. 9.
FIG. 9.
The pH-dependent modulation responses of DM-NERF dextrans and OG-514 dextrans and changes in lysosomal pH detected by these probes after treatments of the proton pump inhibitor bafilomycin A1 (BafA1) and the ionophore monensin. Left: In vitro and in vivo pH calibration curves of DM-NERF and OG-514 established in buffers and cells. Right: Lysosomal pH levels of 3T3 fibroblasts increase after treatments with BafA1and monensin.
FIG. 10.
FIG. 10.
Lysosomal pH images of 3T3 fibroblasts loaded with OG-514 dextrans. a: A resting 3T3 fibroblast. Cells treated with monensin (b) and bafilomycin A1 (c) for 1 h. The average lysosomal pH values derived from images a, b, and c were 4.9, 5.5, and 5.9, respectively.

References

    1. Garlapati S, Dahan E, Shapira M. Effect of acidic pH on heat shock gene expression in leishmania. Mol Biochem Parasitol 1999;100:95–101. - PubMed
    1. Denison SH. pH Regulation of gene expression in fungi. Fungal Genet Biol 2000;29:61–71. - PubMed
    1. Vriesema AJ, Dankert J, Zaat SA. A shift from oral to blood pH is a stimulus for adaptive gene expression of Streptococcus gordonii CH1 and induces protection against oxidative stress and enhanced bacterial growth by expression of msrA. Infect Immun 2000;68:1061–1068. - PMC - PubMed
    1. Bourdineaud JP. At acidic pH, the diminished hypoxic expression of the SRP1/TIR1 yeast gene depends on the GPA2-cAMP and HOG pathway. Res Microbiol 2000;151:43–52. - PubMed
    1. Yamashiro DJ, Maxfield FR. Regulation of endocytic processes by pH. Trends Pharmacol Sci 1988;9:190–193. - PubMed

Substances

LinkOut - more resources