. 2003 Mar 15;23(6):2019-31.
doi: 10.1523/JNEUROSCI.23-06-02019.2003.

Coexistence of excitatory and inhibitory GABA synapses in the cerebellar interneuron network

Affiliations

Coexistence of excitatory and inhibitory GABA synapses in the cerebellar interneuron network

Joël Chavas et al. J Neurosci. .

Abstract

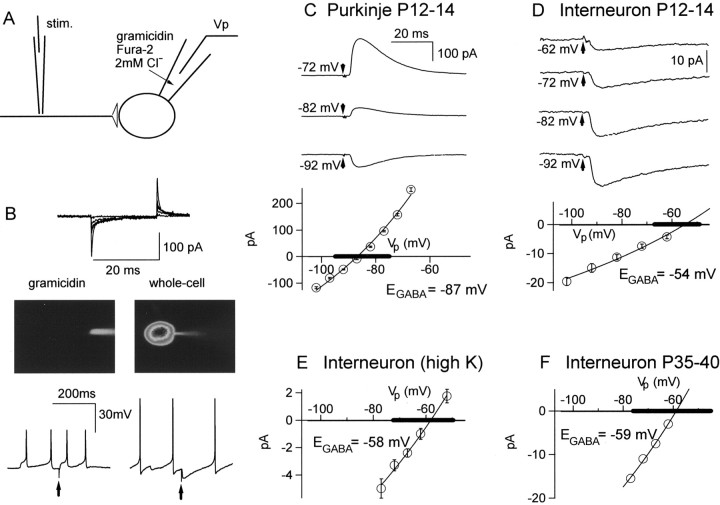
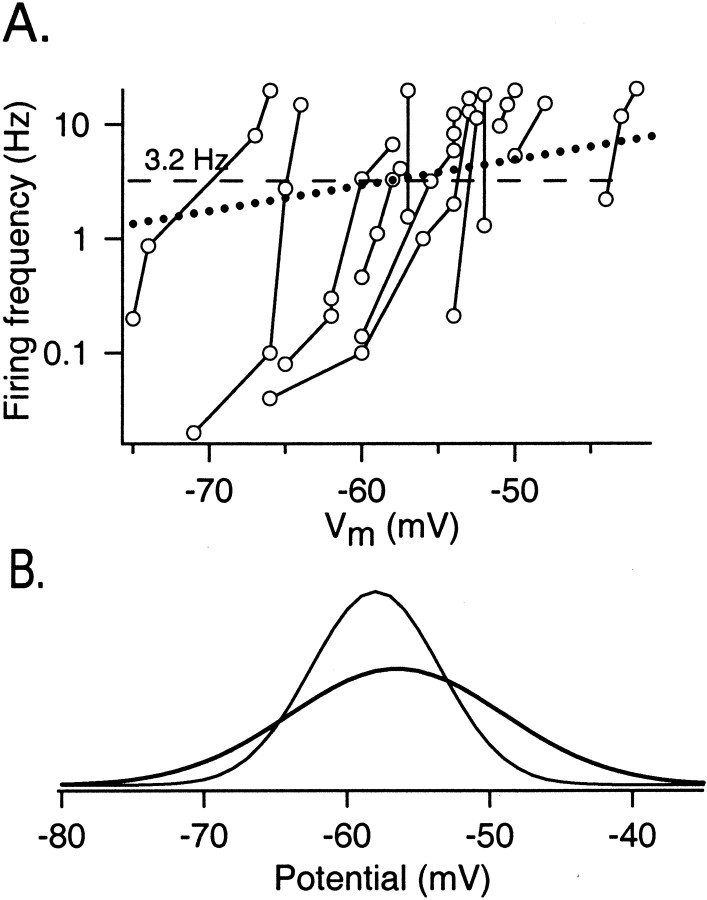
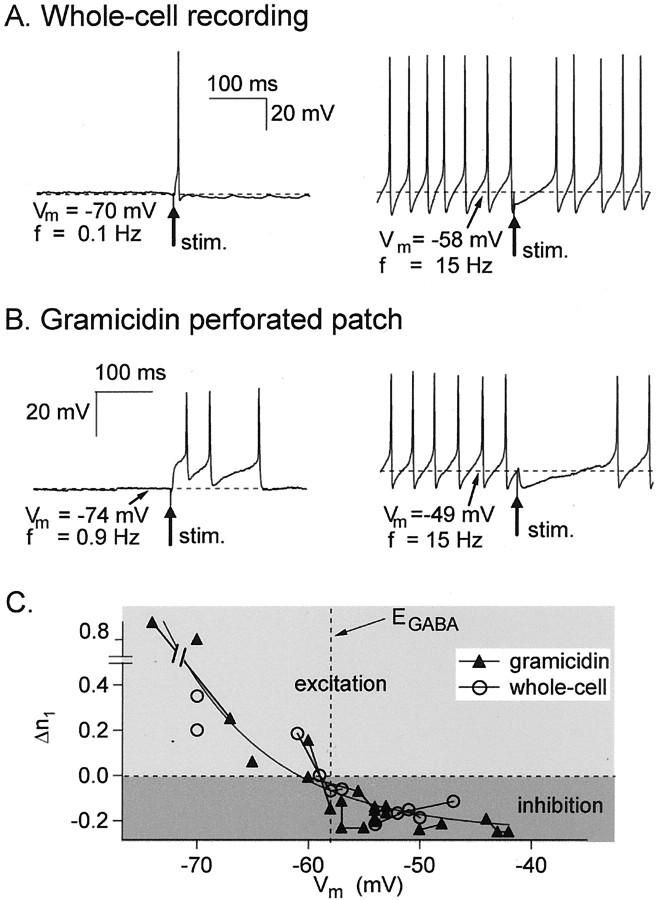
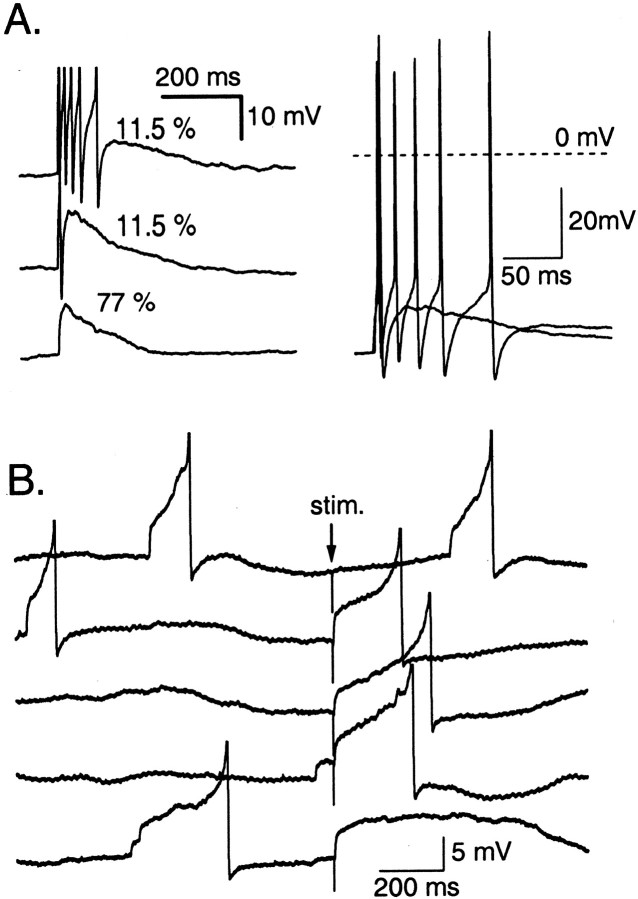
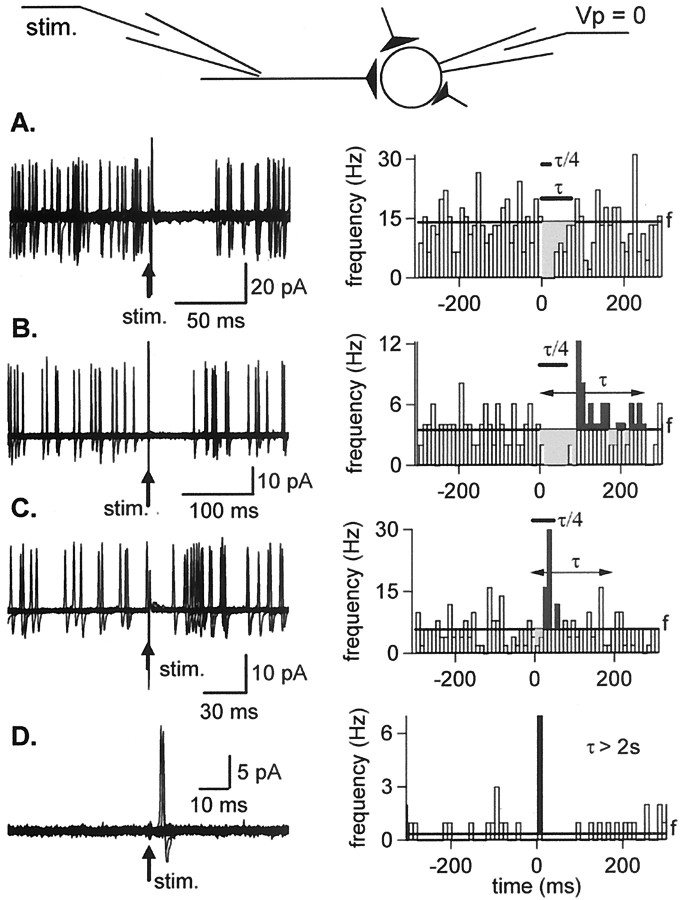
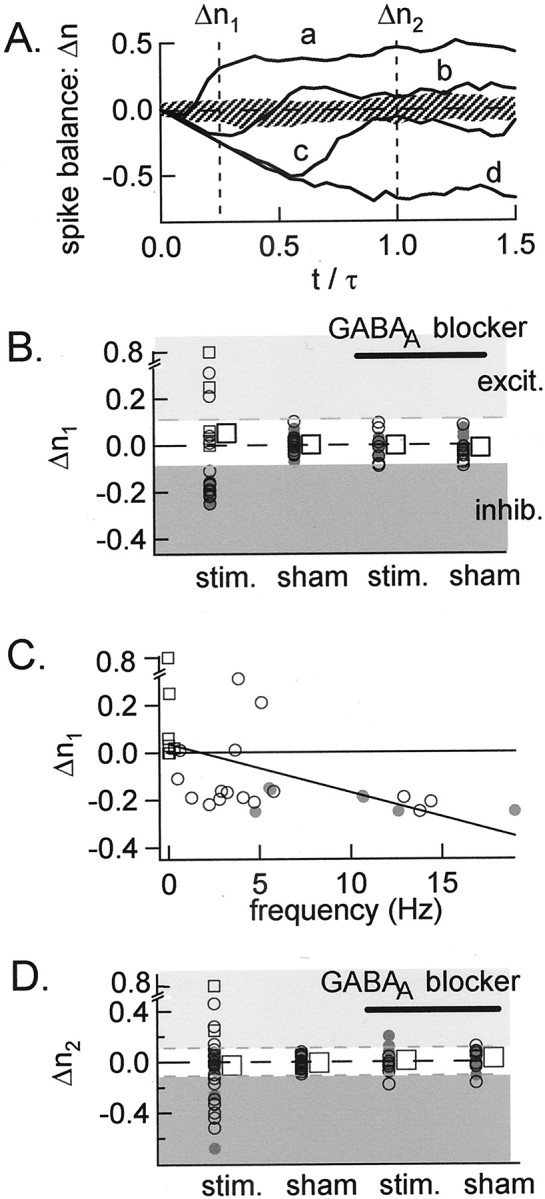
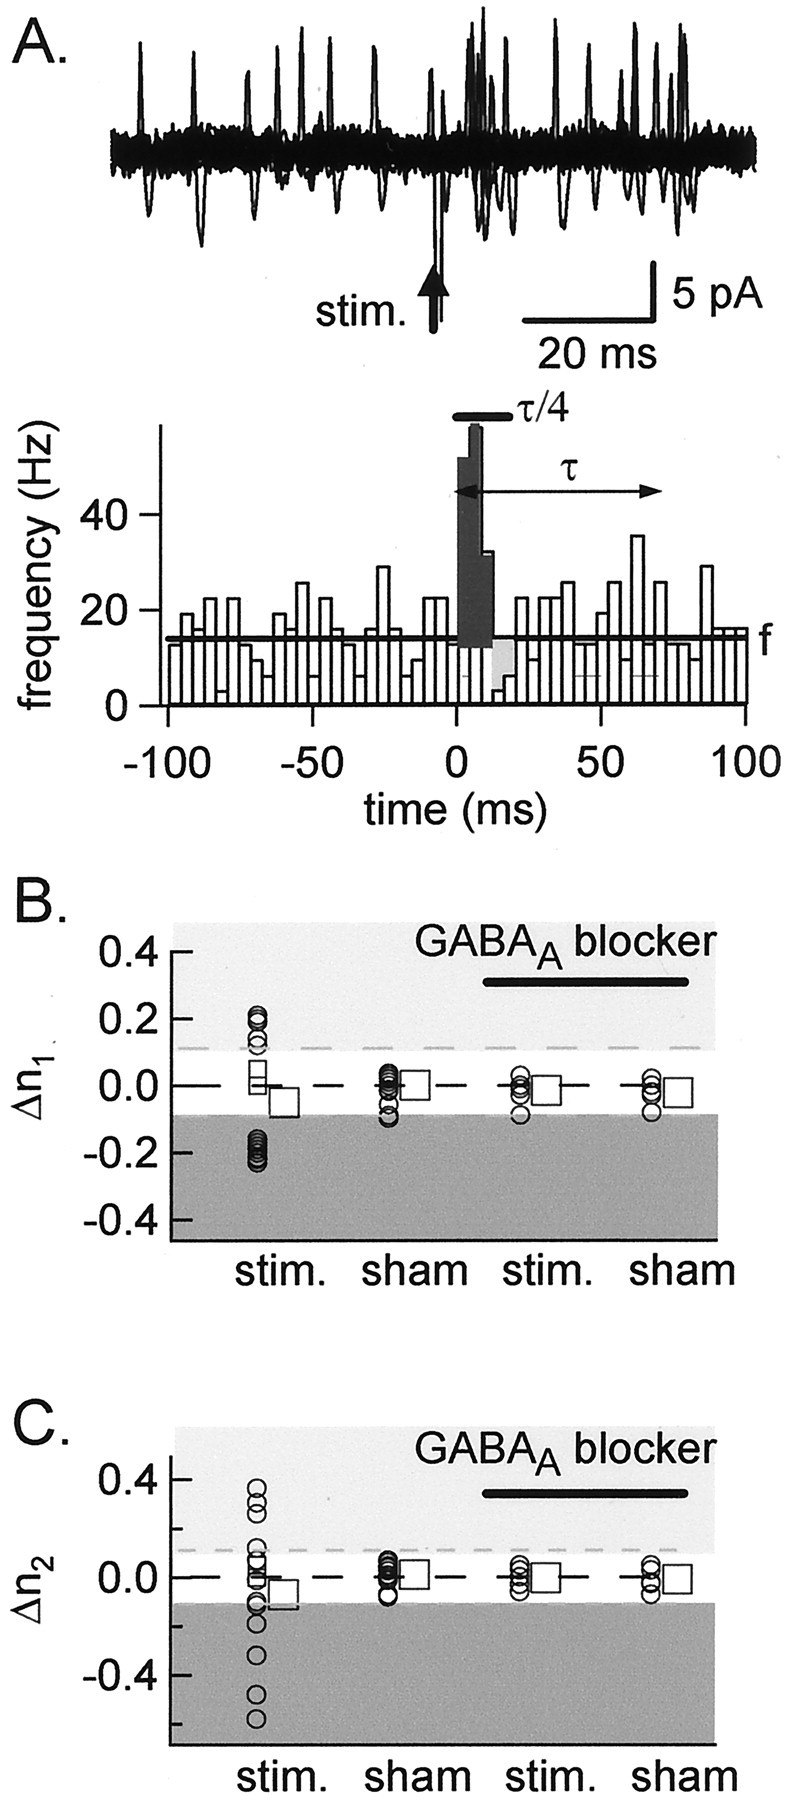
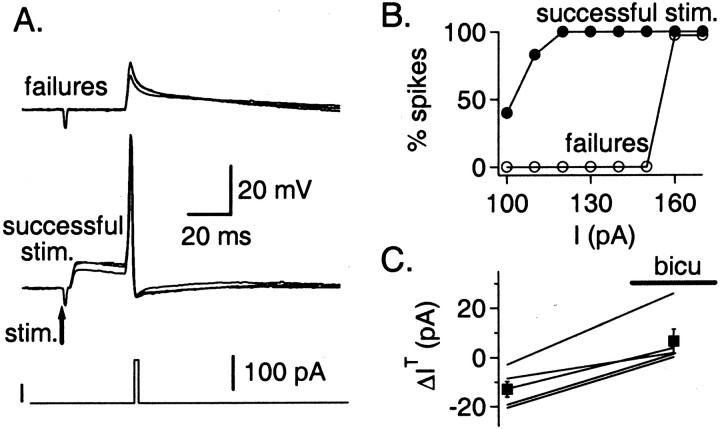
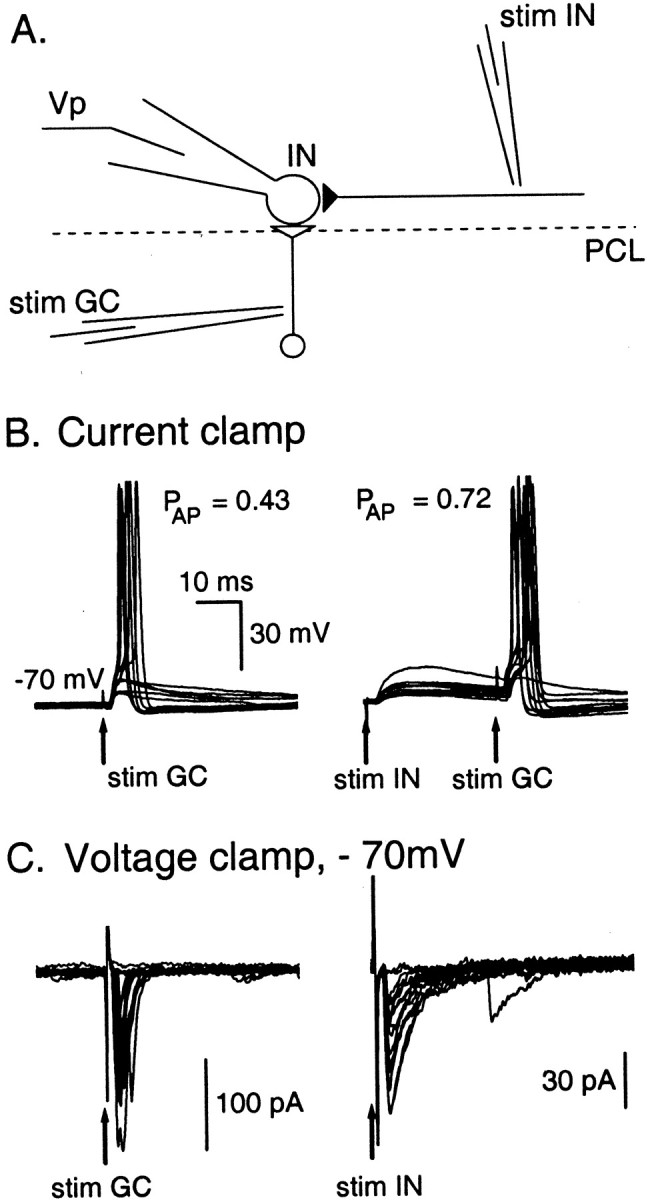
Functional GABA synapses are usually assumed to be inhibitory. However, we show here that inhibitory and excitatory GABA connections coexist in the cerebellar interneuron network. The reversal potential of GABAergic currents (E(GABA)) measured in interneurons is relatively depolarized and contrasts with the hyperpolarized value found in Purkinje cells (-58 and -85 mV respectively). This finding is not correlated to a specific developmental stage and is maintained in the adult animal. E(GABA) in interneurons is close to the mean membrane potential (-56.5 mV, as measured with a novel "equal firing potential" method), and both parameters vary enough among cells so that the driving force for GABA currents can be either inward or outward. Indeed, using noninvasive cell-attached recordings, we demonstrate inhibitory, excitatory, and sequential inhibitory and excitatory responses to interneuron stimulation [results obtained both in juvenile (postnatal days 12-14) and subadult (postnatal days 20-25) animals]. In hyperpolarized cells, single synaptic GABA currents can trigger spikes or trains of spikes, and subthreshold stimulations enhance the responsiveness to subsequent excitatory stimulation over at least 30 msec. We suggest that the coexistence of excitatory and inhibitory GABA synapses could either buffer the mean firing rate of the interneuron network or introduce different types of correlation between neighboring interneurons, or both.


Figures

Fig. 1.
Fig. 1.
Determination of EGABAin INs and Purkinje cells. A, Schematics of the experimental conditions. An interneuron or a Purkinje cell was studied using a gramicidin-perforated patch, with a recording pipette that contained a very low Cl concentration and 600 μm fura-2. An extracellular stimulation (stim.) pipette was positioned in the molecular layer to stimulate presynaptic INs. B, After seal formation, capacitive currents evolved with time over tens of minutes (top panel; from an interneuron recording), reflecting the incorporation of gramicidin channels in the patch. Inspection of the pipette–cell assembly allowed visualizationof spontaneous transitions to the whole-cell recording mode (middle panel). This was accompanied with a shift in the polarity of spontaneous and evoked GPSPs (bottom panel; arrows mark extracellular stimulations of presynaptic INs) as well as an increase of the apparent size of action potentials attributable to the sudden increase of the access conductance to the cell soma. C, Averaged GPSCs obtained at various holding potentials in a Purkinje cell experiment (P12–P14). Bottom panel,I–V curve for this experiment. There is a clear reversal at −87 mV. Pooled results gaveEGABA = −85 ± 7 mV;n = 7; the thick line on theVp axis indicates the corresponding voltage range). D, Similar experiment as performed on INs (P12–P14). The reversal potential is obtained by extrapolation with the Goldman–Hodgkin–Katz equation (−54 ± 4.5 mV in the example shown; −58 mV ± 4.5 mV for a series of 5 cells).E, Similar experiment as performed on P12–P14 INs, with a higher extracellular K+ concentration (5 mm instead of the standard 2.5 mm). Reversal potential, −58 ± 6 mV in the example shown; −61 ± 6 mV for a series of four cells. F, Similar experiment as performed on P35–P40 INs. Here, responses to short puffs of muscimol (10–30 msec; pipette concentration, 20 μm) were used instead of synaptic currents. Reversal potential, −59 ± 8 mV in the example shown; −60 ± 8 mV for a series of seven cells.Thick lines in C–F indicate the range comprising the mean ± 2 SD in each condition.
Fig. 2.
Fig. 2.
Determination of the equal firing potential in interneurons. A,fVm curves. Interneurons were recorded in the current-clamp mode with the gramicidin-perforated patch configuration. The holding current was set in each cell so that its mean firing frequency lay in the range of 0.1–20 Hz. For each holding current, the mean frequency is plotted against the mean potential of the cell. Points joined by aline belong to the same cell. The equal firing potentialVeq is the intersection of thefVm curve of each cell either with the line f = 3.2 Hz (dashed horizontal line), corresponding to the mean firing frequency as measured in cell-attached experiments, or with thefCAVCA curve (dotted line; calculated according to Eq. 8; see). Veq = –56.5 ± 7.5 mV (n = 12); this is our best measurement of the mean membrane potential of the interneurons in this preparation.B, Comparison of two Gaussian curves, with means and variances corresponding to the measurements ofEGABA (thin line) and Veq (thick line). Note that there is a high degree of overlap between the two curves. The curves have been scaled so that their integrals are identical.
Fig. 3.
Fig. 3.
Positive and negative modulation of cell firing as measured in current-clamp experiments. A, Whole-cell experiments, Cli = 15 mm. Left panel, The holding current is set such thatVm ∼ −70 mV; in these conditions, the resting firing frequency, f, is very small. An action potential can be induced by the extracellular stimulation of a presynaptic interneuron (stim. arrow; the probability to obtain a spike was p = 0.2 in this recording).Right panel, with a more depolarized cell (Vm ∼ −58 mV), the stimulation inhibits spontaneous firing (from another experiment). B, Same type of experiments in gramicidin-perforated patch recordings.C, Summary results. Closed triangles(n = 9) and open circles(n = 5) represent, respectively, gramicidin and whole-cell experiments. The y-axis represents Δn1, the net gain or loss of spikes during the period of τ/4 after the stimulation, where τ = 1/f. Results originating from the same cells are connected with lines. The effect of a GPSP is shown to shift from inhibition to excitation forVm ∼ −60 mV. Whole-cell and gramicidin results alike can be fitted with an exponential function, the equation of which is given in (Eq. 6).
Fig. 4.
Fig. 4.
Excitatory spontaneous synaptic potentials.A, Current-clamp recording with a gramicidin-perforated patch. The cell was maintained near –68 mV by injecting a hyperpolarizing current of 20 pA. Glutamatergic synaptic currents were blocked with CNQX and APV. Left, Examples of spontaneous synaptic potentials leading to a train of spikes (top), a single spike (middle), or subthreshold (bottom), with the corresponding occurrence rate.Right, Superimposed plot of the two events with spikes showing the full extent of the action potentials. B, Spontaneous currents recorded in another cell near –66 mV (holding current, −6.6 pA) led mostly to delayed single-spike discharges. Stimulation of INs (stim.) leads to similar excitatory responses. Action potentials are clipped for clarity.
Fig. 5.
Fig. 5.
Variable effects of presynaptic stimulation on cell firing as measured in cell-attached recordings. All recordings were performed with a Na+-rich pipette solution.A, Pure inhibitory response. Left, Superimposed consecutive traces (n = 25) showing the effect of extracellular stimulation (stim.) on spontaneous action potentials as recorded in the cell-attached configuration. Right, Summary plot of instantaneous spiking frequency across the stimulation period. The mean control frequency, f, is represented by a thick horizontal line. Stimulation results in a transient frequency decrease (light gray area). B, Mixed inhibitory–excitatory response. Stimulation results in a transient frequency decrease (light gray area) followed by a frequency increase (dark gray area). C, Results from another experiment in which extracellular stimulation mainly resulted in a frequency increase after a delay of ∼20 msec.D, Excitatory response measured in a cell with very low resting frequency (0.3 Hz). Spikes were observed in 7 of 100 sweeps with a latency of ∼5 msec.
Fig. 6.
Fig. 6.
Spike surplus or deficit after synaptic stimulation at P12–P14. A, Plot of the spike balance as a function of time. The time is counted from the stimulation (stim.) and is normalized with respect to τ. They-axis shows at each time value the difference between the mean total number of observed spikes and the corresponding number expected from the firing frequency measured before the stimulation. The four traces show an almost purely excitatory response (a), mixed inhibitory–excitatory responses (b, c), and a pure inhibitory response (d). The hatched area represents the 95% confidence limit of such traces, measured starting from random points in standard saline solution.B–D, Summary results from 31 experiments.Open and closed symbols represent, respectively, experiments performed with pipettes filled with a Na+- and K+-rich solution.Circles and squares represent cells withf ≥ 0.5 and f < 0.5 Hz, respectively. Data represent the excess or deficit in the number of spikes, which was calculated during an early period of τ/4 after stimulation (B; Δn1) and during a longer period of τ after stimulation (D; Δn2). The first columns show results obtained after extracellular stimulation of GABAergic afferents. Second, third, and fourth columns show control results respectively obtained from data gathered after an arbitrarily chosen time point (located 300 msec before the actual stimulation), after the stimulus in the presence of a GABAA blocker (bicuculline or gabazine), and after an arbitrarily chosen time point in the presence of a GABAAblocker. In B and D, dotted lines delimit the calculated 95% confidence interval on the value of Δn1 and Δn2, respectively.C, Δn1 is significantly correlated (p < 0.01) to the resting firing frequency. Low-frequency cells tend to display excitatory responses, and high-frequency cells display inhibitory responses. Large squares in B and D indicate average values across all experiments. In C andD, dark gray areas contain cells significantly inhibited by a GPSP; light gray areascontain cells significantly excited by a GPSP (see Results).excit., Excitation; inhib., inhibition.
Fig. 7.
Fig. 7.
Effects of presynaptic stimulation measured in cell-attached recordings at P20–P25. Symbols are identical to those of Fig. 6. A, Example of a cell excited by a GPSP. Top, Superimposed consecutive traces(n = 25), showing the effect of a spontaneous GPSP on the cell firing as measured in a basket cell of a P24 animal.Bottom, Summary plot of instantaneous spiking frequency across the stimulation (stim.) period. Stimulation mainly results in a strong frequency increase (dark gray area). This was abolished by bicuculline (seeB). B, C, Summary results from 15 experiments. Both inhibition (dark gray areas) and excitation (light gray areas) are observed at τ/4 and τ. Note that the proportion of low-frequency cells (open squares) is lower at P20–P25 than at P12–P14 (compare with Fig. 6C,D).
Fig. 8.
Fig. 8.
Enhanced excitability of the postsynaptic cell after presynaptic stimulation. A, A 1 msec current pulse is induced 30 msec after the stimulation (stim.) of a presynaptic interneuron. The current pulse does not reach threshold when synaptic transmission fails but always induces an action potential after a successful stimulation (whole-cell recording;Vm = −71 mV; Cli = 15 mm). B, For this cell, the current thresholdIT for stimulation, defined as the current needed to induce an action potential with a probability ofp = 0.5, is 55 pA smaller after a successful GABAergic stimulation than after a failure. C, The mean difference ΔIT between the current threshold measured after the stimulation and its control value measured before the stimulation is plotted for five cells in saline solution (ΔIT = −12.9 ± 3.2 pA) and in bicuculline (bicu; ΔIT= 6.5 ± 4.8 pA). In this plot, no distinction is made according to whether the stimulation elicited a synaptic current or led to a failure. On average, ΔIT increases by 19.3 ± 3 pA between the two conditions (p < 0.005).
Fig. 9.
Fig. 9.
Interactions between glutamatergic and GABAergic synaptic inputs. A, Schematics of the experimental conditions: one extracellular stimulation pipette (stim IN) was positioned in the molecular layer near the Purkinje cell layer (PCL) to stimulate presynaptic INs, and another one (stim GC) was placed in the granular cell layer to stimulate ascending axons from granule cells or climbing fibers. The postsynaptic IN is recorded in whole-cell configuration using a physiological Cl concentration (Cli = 15 mm). B, Current-clamp experiment (Vm ∼ −70 mV). Superimposed traces (10 in eachpanel) show that the probability for a successful glutamatergic stimulation to induce an action potential increases fromp = 0.43 to p = 0.72 (n = 60 trials in each condition;p < 0.01) if it occurs 30 msec after a successful GABAergic stimulation. Therefore, 30 msec after a GPSP, the excitability of the cell is increased. C, Synaptic currents recorded under voltage-clamp conditions for the same cell as in B. The two panels show superimposedtraces of postsynaptic currents induced by stim GC and stim IN, respectively. Exponential fits to the decays of the synaptic currents gave time constants of 1 and 7 msec, respectively. The marked differences in the time courses of decay for the two sets of traces demonstrate that stim GC and stim IN respectively induce only EPSCs and only GPSCs. Note that at the time chosen for the second stimulus, GABAergic currents have fully subsided, so that shunting inhibition does not play a role here.

References

    1. Aizenman CD, Linden DJ. Regulation of the rebound depolarization and spontaneous firing patterns of deep nuclear neurons in slices of rat cerebellum. J Neurophysiol. 1999;82:1697–1709. - PubMed
    1. Armstrong DM, Rawson JA. Activity patterns of cerebellar cortical neurons and climbing fibre afferents in the awake cat. J Physiol (Lond) 1979;289:425–448. - PMC - PubMed
    1. Bal T, von Krosigk M, McCormick DA. Synaptic and membrane mechanisms underlying synchronized oscillations in the ferret geniculate nucleus in vitro. J Physiol (Lond) 1995;483:641–663. - PMC - PubMed
    1. Ben-Ari Y, Cherubini E, Corradetti R, Gaïarsa JL. Giant synaptic potentials in immature rat CA3 hippocampal neurones. J Physiol (Lond) 1989;416:303–325. - PMC - PubMed
    1. Bormann J, Hamill OP, Sakmann B. Mechanism of anion permeation through channels gated by glycine and γ-aminobutyric acid in mouse cultured spinal neurons. J Physiol (Lond) 1987;385:243–286. - PMC - PubMed

Publication types

MeSH terms

LinkOut - more resources