. 2003 Mar 15;23(6):2075-85.
doi: 10.1523/JNEUROSCI.23-06-02075.2003.

Neurotrophin-regulated sorting of opioid receptors in the biosynthetic pathway of neurosecretory cells

Affiliations

Neurotrophin-regulated sorting of opioid receptors in the biosynthetic pathway of neurosecretory cells

Kyung-Ah Kim et al. J Neurosci. .

Abstract

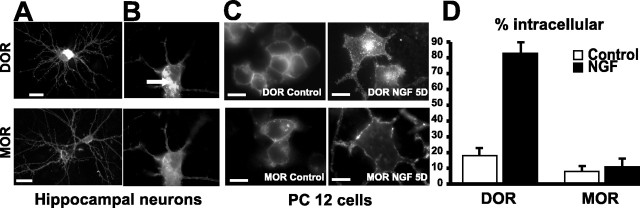
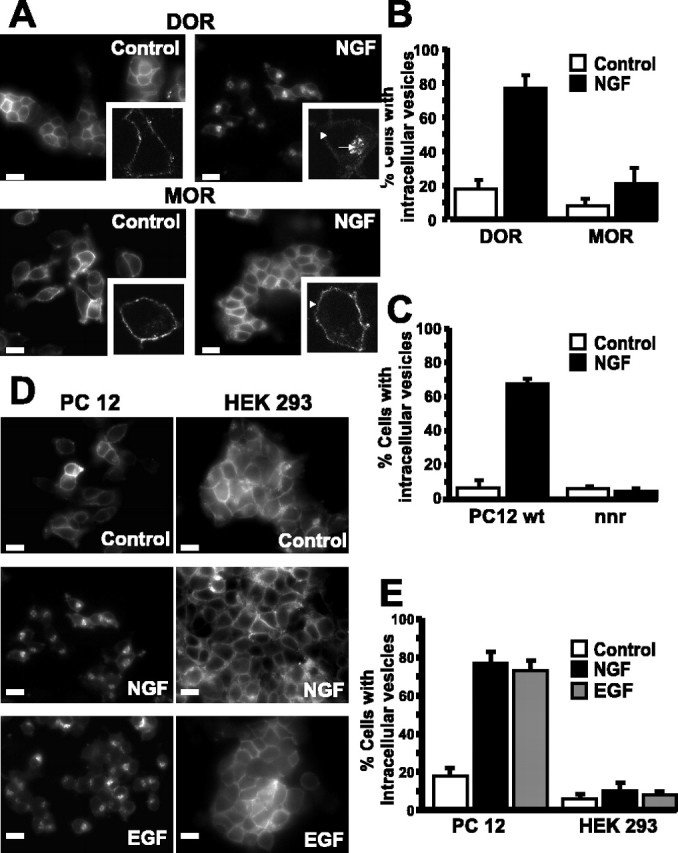
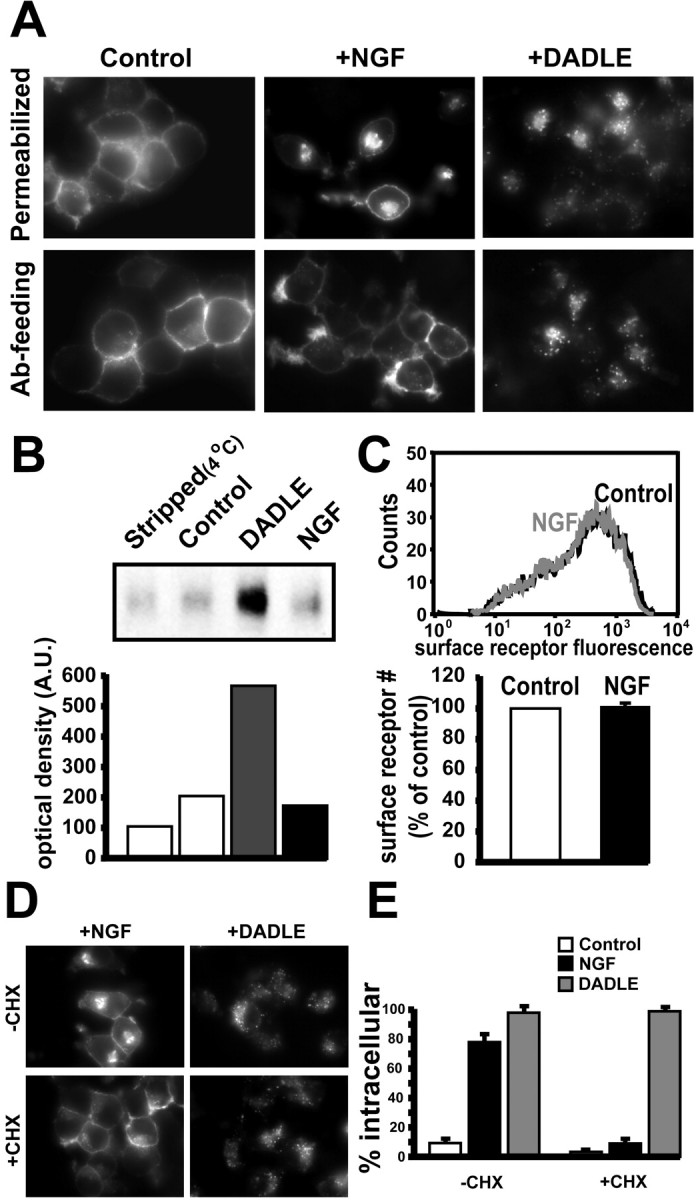
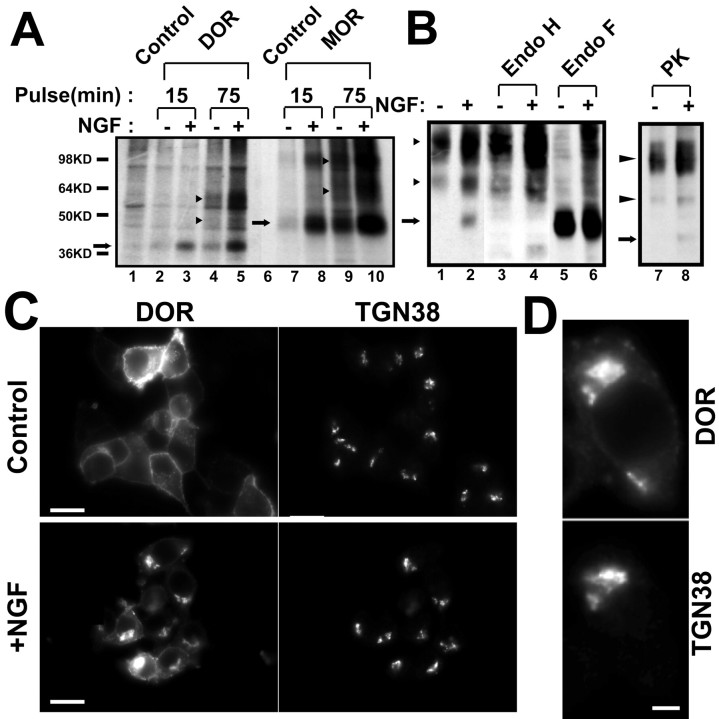
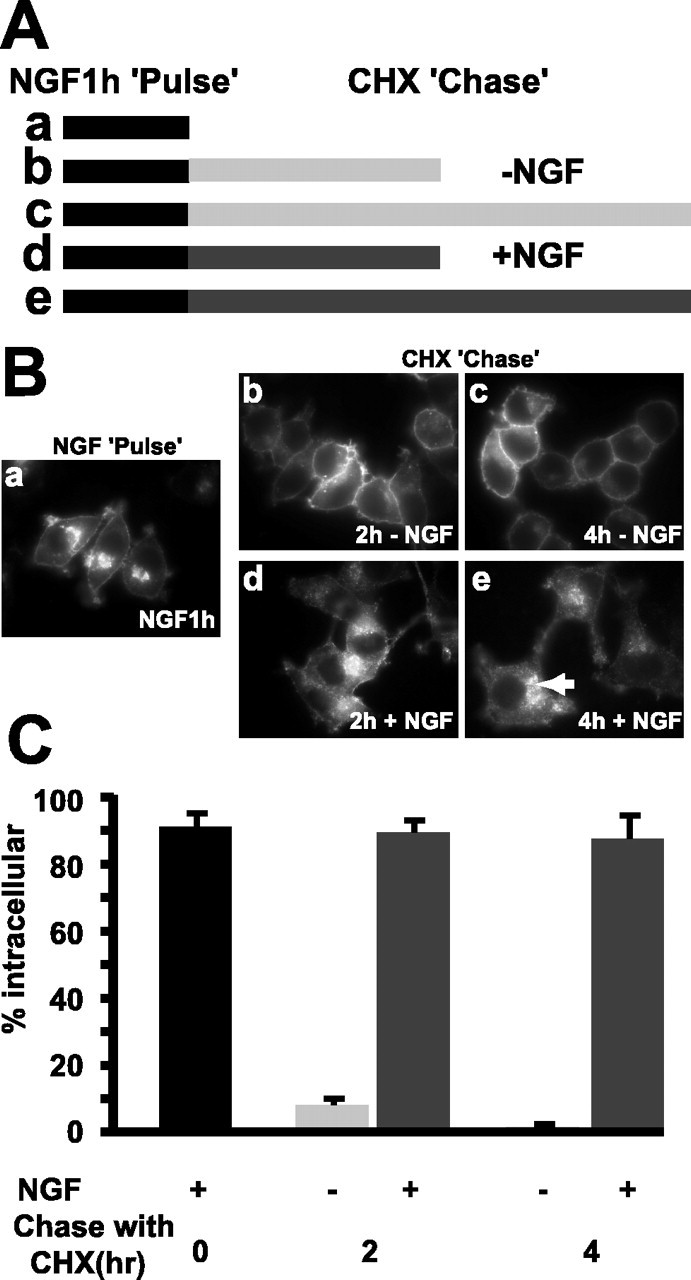
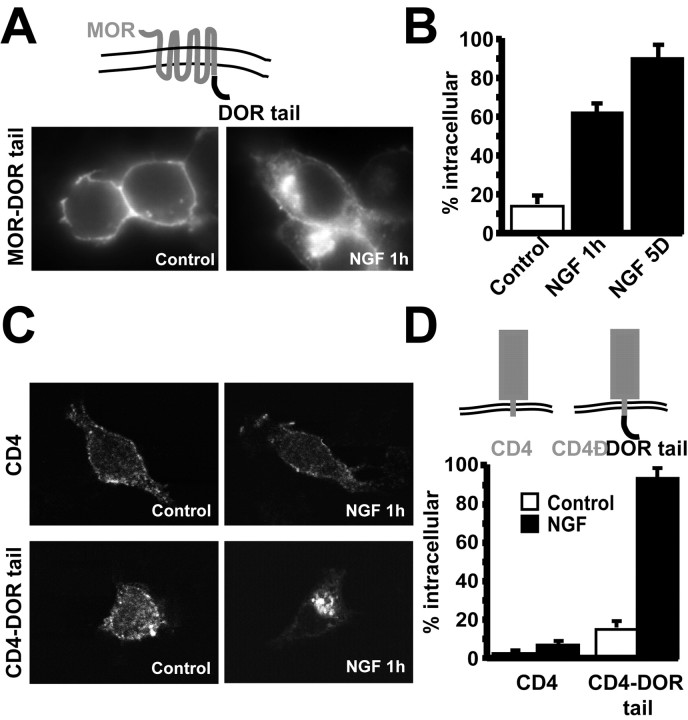
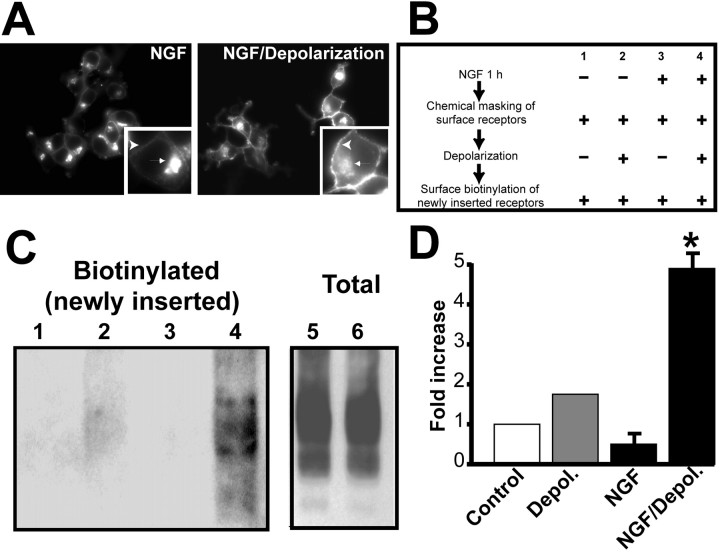
Neurotrophins modulate the endogenous opioid system, but the underlying mechanisms are poorly understood. We observed an unexpected effect of neurotrophin signaling on the membrane trafficking of recombinant opioid receptors expressed in neurosecretory cells. Epitope-tagged delta opioid receptor (DOR) and mu opioid receptor (MOR) were differentially localized between surface and internal membrane pools, respectively, when expressed in primary cultured hippocampal neurons, consistent with previous studies by others of natively expressing neurons. Selective intracellular targeting of DOR was observed in nerve growth factor (NGF)-differentiated PC12 neurosecretory cells but not in PC12 cells cultured in the absence of NGF, where both DOR and MOR were localized in the plasma membrane. Surprisingly, NGF initiated intracellular targeting of DOR in PC12 cells acutely, within 60 min after initial activation of TrkA. The NGF-induced intracellular pool of DOR originated from a late stage of the biosynthetic pathway after exit from the endoplasmic reticulum and processing of N-linked glycans in the Golgi, resulting in the accumulation in cells of a biochemically mature "reserve" pool of intracellular DOR that exhibited depolarization-dependent insertion into the plasma membrane. The C-terminal cytoplasmic tail of DOR contains a signal determining the specificity of NGF-regulated intracellular targeting. These results indicate that cloned opioid receptors are differentially targeted when expressed heterologously in neurosecretory cells, establish a model system that facilitates mechanistic study of this process, and suggest a novel function of neurotrophins in modulating the anterograde membrane trafficking of opioid receptors.


Figures

Fig. 1.
Fig. 1.
Subtype-specific targeting of opioid receptors in transfected hippocampal neurons and PC12 neurosecretory cells.A, Hippocampal neurons in primary culture were transfected with FLAG-tagged DOR or MOR. Cells were fixed 3 d after transfection and permeabilized, and the subcellular distribution of receptors was visualized by indirect immunofluorescence microscopy. Representative epifluorescence images are shown. Scale bars, 20 μm.B, Higher-magnification view of a cultured hippocampal neuron cotransfected with plasmids encoding FLAG-tagged DOR and HA-tagged MOR after fixation and dual localization of receptors. Scale bar, 10 μm. C, Stably transfected PC12 cells expressing epitope-tagged DOR or MOR were incubated with 50 ng/ml NGF for 5 d to promote morphological differentiation and then fixed and processed for immunofluorescence microscopy. Representative micrographs of untreated control and NGF-differentiated cells are shown. Scale bars, 10 μm. D, Quantitative analysis of the results illustrated in C, conducted by scoring ∼100 cells for each condition in each experiment. The proportion of cells in which receptors were localized predominantly in intracellular membranes (determined in blinded samples as described in Materials and Methods) is presented as mean ± SEM determined from analysis of three independent experiments.
Fig. 2.
Fig. 2.
Intracellular targeting of DOR is induced rapidly by receptor-Tyr kinase activation specifically in neurosecretory cells.A, Stably transfected PC12 cells expressing epitope-tagged DOR or MOR were maintained in normal culture medium and then incubated for 60 min in the absence (Control) or presence (NGF) of 100 ng/ml added NGF. NGF effects on DOR localization were visualized by epifluorescence microscopy (top row, main panels) and was confirmed at higher magnification in confocal optical sections imaged through the center of cells (bottom right inset; arrow indicates the intracellular membrane pool, and arrowhead indicates plasma membrane). NGF caused no detectable change in the plasma membrane localization of MOR (bottom row, main panels) visualized by epifluorescence (main panels) and in confocal optical sections (bottom right inset; arrowheadindicates plasma membrane). B, Quantification of the acute NGF effect was conducted by scoring ∼100 cells (selected at random in coded specimens) for each condition in each experiment. The proportion of cells characterized by pronounced intracellular localization of DOR or MOR (using the criteria described in Materials and Methods) is presented as mean ± SEM, compiled from three independent experiments. C, Wild-type (PC12 wt) or TrkA-deficient (nnr) PC12 cells were transiently transfected with HA-tagged DOR and analyzed for NGF-induced intracellular targeting of DOR using same method as that applied to stably transfected cells (B). Data represent means ± SEM from three independent experiments. D, Localization of HA-tagged DOR in stably transfected PC12 neurosecretory cells or HEK293 cells (selected for comparable levels of DOR expression) was examined in cells maintained in normal culture medium and then serum-starved for 120 min (Control) and compared with that in serum-deprived cells in which NGF (100 ng/ml) or epidermal growth factor (EGF; 100 ng/ml) was added to the culture medium for 60 min before fixation. Both NGF and EGF caused pronounced intracellular targeting of DOR in PC12 cells (left panels), whereas neither NGF nor EGF caused a detectable effect on DOR localization in HEK293 cells (right panels).E, Quantification of experiments illustrated inD. Randomly selected images were scored blindly as inB (∼100 cells per condition per experiment). Results are presented as mean fraction of cells displaying pronounced intracellular DOR immunoreactivity ± SEM, compiled from three independent experiments.
Fig. 3.
Fig. 3.
NGF-induced intracellular targeting of DOR is not mediated by endocytosis and requires biosynthesis of new receptor protein. A, Stably transfected PC 12 cells expressing HA-tagged DOR were treated with 100 ng/ml NGF (1 hr) or 10 μm of the opioid peptide agonist DADLE (30 min), fixed, and permeabilized to visualize intracellular distribution of DOR by immunofluorescence microscopy (top panels,Permeabilized). To specifically detect endocytosis of receptors, an antibody-feeding experiment was performed (bottom panels, Ab-feeding). Cells were preincubated with anti-HA antibody for 20 min followed by NGF or DADLE treatment as above and then fixed, permeabilized, and processed for immunofluorescence microscopy to detect internalization of surface-labeled receptors. B, Endocytosis of DOR expressed in stably transfected PC12 cells was analyzed by surface biotinylation assay, as described in Materials and Methods. Cells were surface-biotinylated at 4°C and then incubated with either DADLE (10 μm) or NGF (100 ng/ml) for 30 and 60 min, respectively, at 37°C, followed by analysis of detection of internalized receptors by their resistance to cleavage by a membrane-impermeant reducing agent. Stripped indicates the efficiency of cleavage of surface biotins under conditions in which endocytosis is blocked (4°C), and Control represents the amount of signal representing the low level of (constitutive) internalization observed (at 37°C) in the absence of ligand. The top panel is a representative blot, and the bars (bottom panel) represent the results of densitometric scanning from two independent experiments. C, Surface-exposed DOR was analyzed by fluorescence flow cytometry, as described in Materials and Methods. PC12 cells stably expressing DOR were incubated with or without NGF (100 ng/ml) for 1 hr, and cell surface receptors were labeled with HA 11 antibody and quantified by flow cytometry. Representative histograms from analysis of 10,000 cells from untreated (Control, black) and NGF-treated specimens (NGF, gray) are overlaid. Nonspecific background staining (determined by staining PC12 cells not expressing epitope-tagged receptors) was <10 U on this fluorescence scale. D, Stably transfected PC12 cells were incubated with the protein synthesis inhibitor CHX (3 μg/ml) for 30 min before the treatment with NGF (100 ng/ml) or DADLE (10 μm) followed by immunocytochemical staining to visualize distribution of DOR. E, Quantitative analysis of the results depicted in D was conducted as in Figure2, and data represent mean ± SEM from three independent experiments.
Fig. 4.
Fig. 4.
NGF regulates export of DOR from thetrans-Golgi network. A, PC12 cells stably expressing HA-tagged DOR or FLAG-tagged MOR were preincubated with NGF (100 ng/ml) for 30 min and then labeled with [35S]Cys-Met for the indicated times, as described further in Materials and Methods. The cell lysate was immunoprecipitated with antibodies to HA or FLAG epitopes, respectively, and immunoprecipitates were resolved by SDS-PAGE (10% acrylamide). A fluorograph representative of three independent experiments is shown. Arrows indicate immature (core glycosylated) species, and arrowheads indicate mature (complex glycosylated) forms of the indicated opioid receptors. NGF increased biosynthesis of both DOR (lanes 3, 5) and MOR (lanes 8, 10) at both time points to a similar extent (∼80% as estimated by densitometric scanning). B, Enzymatic deglycosylation was used to confirm the existence of mature and immature forms of DOR detected in cell lysates prepared from control or acutely NGF-treated cells by immunoblotting (left panel). Lysates were undigested (lanes 1, 2) or incubated with either endoglycosidase H (Endo H; lanes 3, 4) or endoglycosidase F (Endo F; lanes 5, 6) at a final concentration of 50 U/ml for 1 hr at 37°C. Samples were resolved by SDS-PAGE and transferred to nitrocellulose membranes, and receptors were detected using HA11 antibody. To specifically detect the intracellular pool of DOR, intact cells were incubated in the presence of proteinase K (PK) at 4°C; to cleave the N-terminal epitope from receptors present in the plasma membrane, protease activity was quenched, and the protease-resistant (internal) receptors were detected. The predominant form of DOR detected in intracellular membranes of PC12 cells corresponded to the mature, complex glycosylated form. NGF caused a pronounced increase in the amount of this intracellular receptor pool (lanes 7, 8).C, Colocalization of DOR with the TGN marker TGN38 was visualized by costaining cells with anti-HA and anti-TGN38 antibodies. Cells were treated with NGF for 1 hr and then stained for HA-tagged DOR and TGN38, as described in Materials and Methods. Representative epifluorescence microscopic images are shown. Scale bars, 10 μm.D, Higher magnification of DOR compared with TGN38 distribution in an individual NGF-treated cell. Scale bar, 3 μm.
Fig. 5.
Fig. 5.
NGF inhibits constitutive trafficking of DOR from the post Golgi membrane pool to the plasma membrane. A, Diagram showing a pulse–chase protocol designed to examine the effect of NGF on anterograde membrane trafficking of previously synthesized DOR. Cells were pulsed with NGF (100 ng/ml) for 1 hr to induce the accumulation of receptors in intracellular membranes and chased in the presence of CHX (3 μg/ml) either with (d, e) or without (b, c) NGF. B, Representative micrographs showing effects on the intracellular membrane pool of DOR during the pulse–chase protocol. The internal membrane pool of DOR present initially after the NGF pulse (a) was chased out almost completely within 2 hr after removal of NGF (b) and was undetectable after 4 hr (c). The continued presence of NGF in the culture medium markedly stabilized the intracellular pool of DOR, such that a pronounced internal membrane pool was observed after 2 hr (d) and even 4 hr (e) in the absence of new protein synthesis. C, Bar graph displaying the results of quantitative analysis of coded specimens. Data represent means ± SEM, compiled from three independent experiments.
Fig. 6.
Fig. 6.
The C-terminal cytoplasmic domain of DOR contains an autonomous intracellular targeting signal. A, Stably transfected PC12 cells expressing a FLAG-tagged chimeric MOR containing divergent residues from the distal cytoplasmic tail of DOR (residues 345–372) were incubated in the absence (Control) or presence (NGF) of NGF (100 ng/ml) for 1 hr, fixed, and processed for immunocytochemical staining. Representative micrographs of receptor localization in control and NGF-treated cells are shown. B, Quantitative analysis of coded specimens corresponding to the experiment illustrated in A, as well as in cells incubated with NGF for 5 d (as in Fig. 1), was conducted as described above, and data represent means ± SEM from three independent experiments. C, PC12 cells were transiently transfected with an expression construct encoding CD4 or the CD4-DOR tail fusion, as described in Materials and Methods. Forty-eight hours after transfection, cells were incubated in the absence or presence of 100 ng/ml NGF for 1 hr, and then cells were fixed, and CD4 proteins were localized using anti-CD4 antibody. Confocal optical sections (∼0.5 μm thick) taken through the centers of cells are shown. D, Quantitative analysis of the results described in C. Bars represent means ± SEM from three independent experiments, each involving blinded analysis of ∼100 cells selected at random per condition.
Fig. 7.
Fig. 7.
DOR present in the intracellular membrane pool can undergo regulated insertion into the plasma membrane. A, PC12 cells stably expressing HA-tagged DOR were treated with NGF (100 ng/ml) for 1 hr to induce a visible intracellular membrane pool (left panel, inset, small arrowhead), and then cells were incubated for an additional 30 min in normal medium still containing added NGF (NGF) or the same medium supplemented with 55 mm KCl (NGF/Depolarization) before fixation and analysis of receptor localization by fluorescence microscopy.Inset, Examples of cells suggesting a depolarization-induced decrease of the intracellular membrane pool of DOR (arrow) and a moderate increase in the amount of immunoreactive DOR visualized in the plasma membrane (arrowhead). This effect was seen in the majority (∼70%) of cells but was rarely complete, such that some residual internal DOR staining was visualized in >90% cells even after depolarization for 60 min (results not shown). B, Schematic of the surface modification protocol developed to specifically detect depolarization-induced insertion of DOR into the plasma membrane. Cells were treated with NGF for 1 hr to form intracellular vesicles and incubated with sulfo-NHS AMCA at room temperature to chemically mask receptors present in the plasma membrane by exhaustively derivatizing reactive amine moieties accessible to the cell surface. Cells were then incubated for 30 min at 37°C in the indicated medium and rapidly chilled to 4°C, and newly inserted receptors were detected by their ability to be labeled using sulfo-NHS-biotin. The numbers above each set of experimental conditions correspond to the lanes inC. C, Extracts were prepared from biotinylated cells, and total cell lysate (Total) or biotinylated proteins isolated from extracts by binding to streptavidin-agarose (Biotinylated) were resolved by SDS-PAGE and analyzed by immunoblotting using anti-HA monoclonal antibody to detect HA-tagged DOR. Biotinylated (newly inserted) receptors detected in PC12 cells incubated control medium in the absence of NGF (lane 1), DOR-expressing cells in control medium followed by depolarization (lane 2), NGF treatment for 60 min (lane 3), and NGF treatment for 60 min followed by depolarization (lane 4) are shown. Immunoblotting of total cell lysates (lanes 5, 6, representing 5% of the total cell lysate) indicated that depolarization caused no detectable change of total DOR present in cells, confirming that the depolarization-induced increase in surface-biotinylated DOR represents a redistribution of intracellular receptors to the cell surface. The immunoblot shown is representative of three independent experiments for NGF-treated cells and two experiments for control cells (not exposed to NGF).D, Quantification of these results by scanning densitometry. Bars represent mean ± SEM (n = 3 independent experiments). *Statistical significance of the difference between depolarized and nondepolarized surface expression, defined asp < 0.02 using Student's ttest.

Similar articles

Cited by

References

    1. Beattie EC, Stellwagen D, Morishita W, Bresnahan JC, Ha BK, Von Zastrow M, Beattie MS, Malenka RC. Control of synaptic strength by glial TNFalpha. Science. 2002;295:2282–2285. - PubMed
    1. Beczkowska IW, Gracy KN, Pickel VM, Inturrisi CE. Detection of delta opioid receptor and N-methyl-d-aspartate receptor-like immunoreactivity in retinoic acid-differentiated neuroblastoma x glioma (NG108–15) cells. J Neurosci Res. 1997;47:83–89. - PubMed
    1. Cahill CM, Morinville A, Lee MC, Vincent JP, Collier B, Beaudet A. Prolonged morphine treatment targets δ opioid receptors to neuronal plasma membranes and enhances δ-mediated antinociception. J Neurosci. 2001;21:7598–7607. - PMC - PubMed
    1. Cao TT, Mays RW, von Zastrow M. Regulated endocytosis of G protein-coupled receptors by a biochemically and functionally distinct subpopulation of clathrin-coated pits. J Biol Chem. 1998;273:24592–24602. - PubMed
    1. Cao TT, Deacon HW, Reczek D, Bretscher A, von Zastrow M. A kinase-regulated PDZ-domain interaction controls endocytic sorting of the beta2-adrenergic receptor. Nature. 1999;401:286–290. - PubMed

Publication types

MeSH terms