. 2003 Mar 15;23(6):2102-11.
doi: 10.1523/JNEUROSCI.23-06-02102.2003.

Voltage-gated sodium channels and ankyrinG occupy a different postsynaptic domain from acetylcholine receptors from an early stage of neuromuscular junction maturation in rats

Affiliations

Voltage-gated sodium channels and ankyrinG occupy a different postsynaptic domain from acetylcholine receptors from an early stage of neuromuscular junction maturation in rats

Sarah J Bailey et al. J Neurosci. .

Abstract

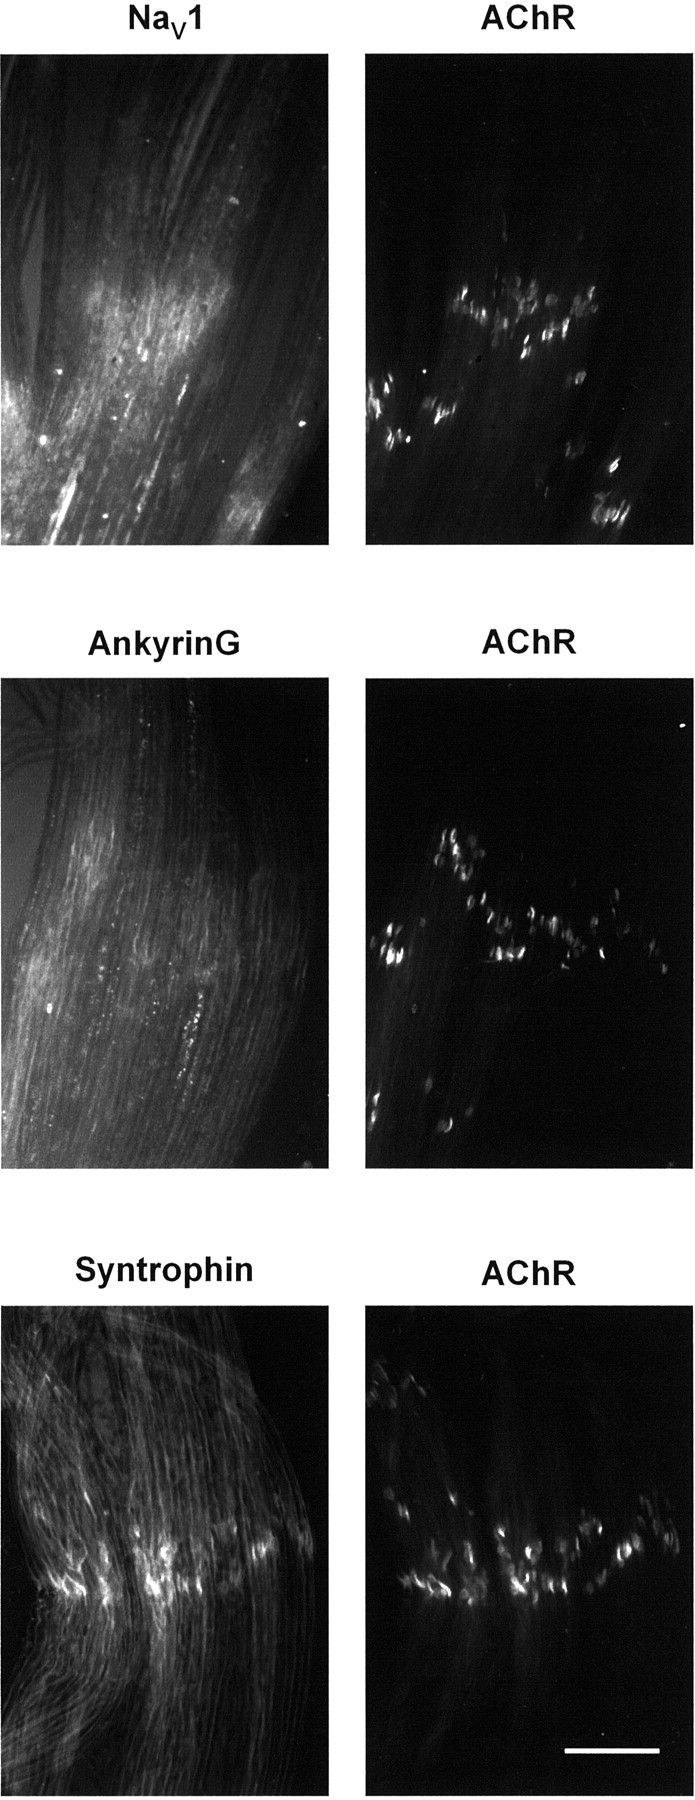
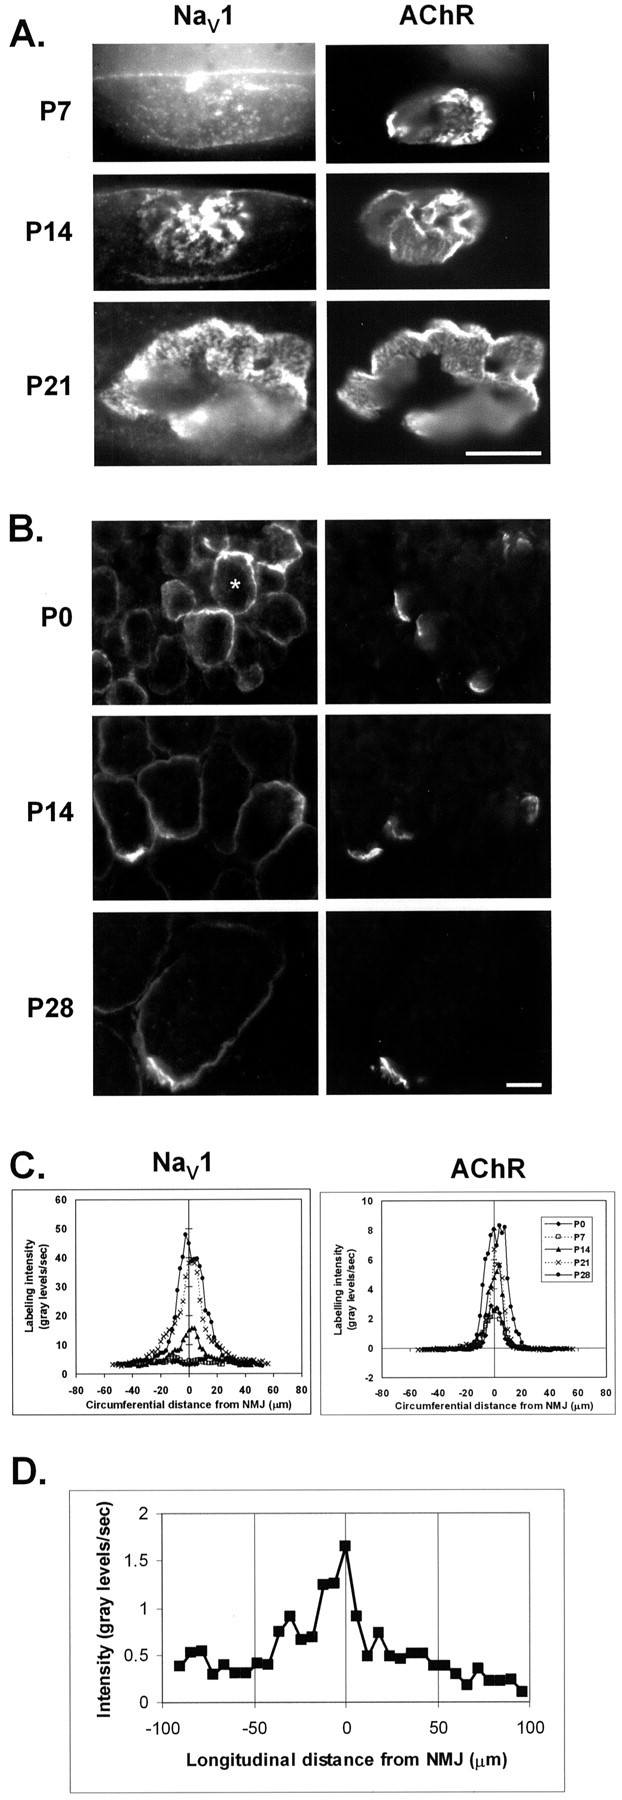
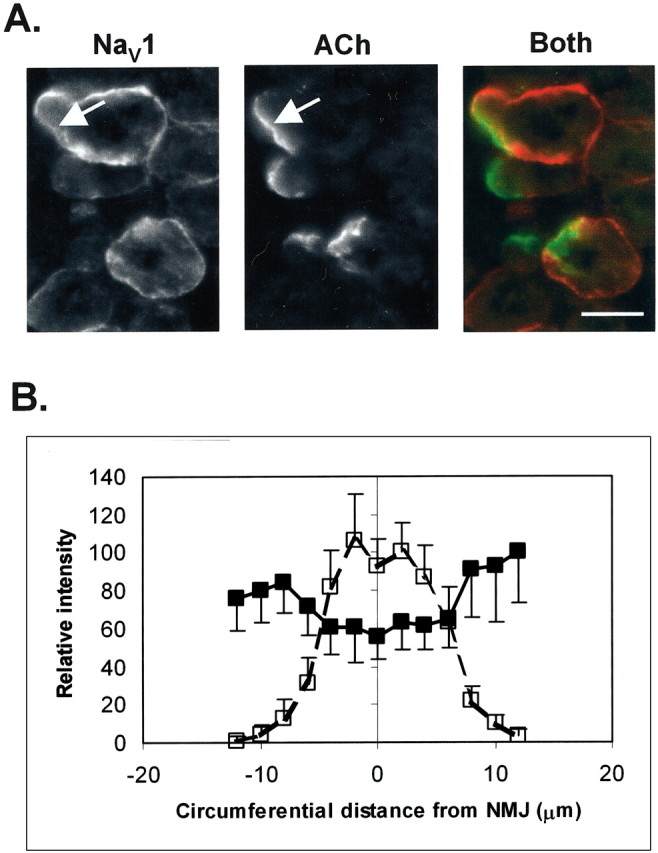
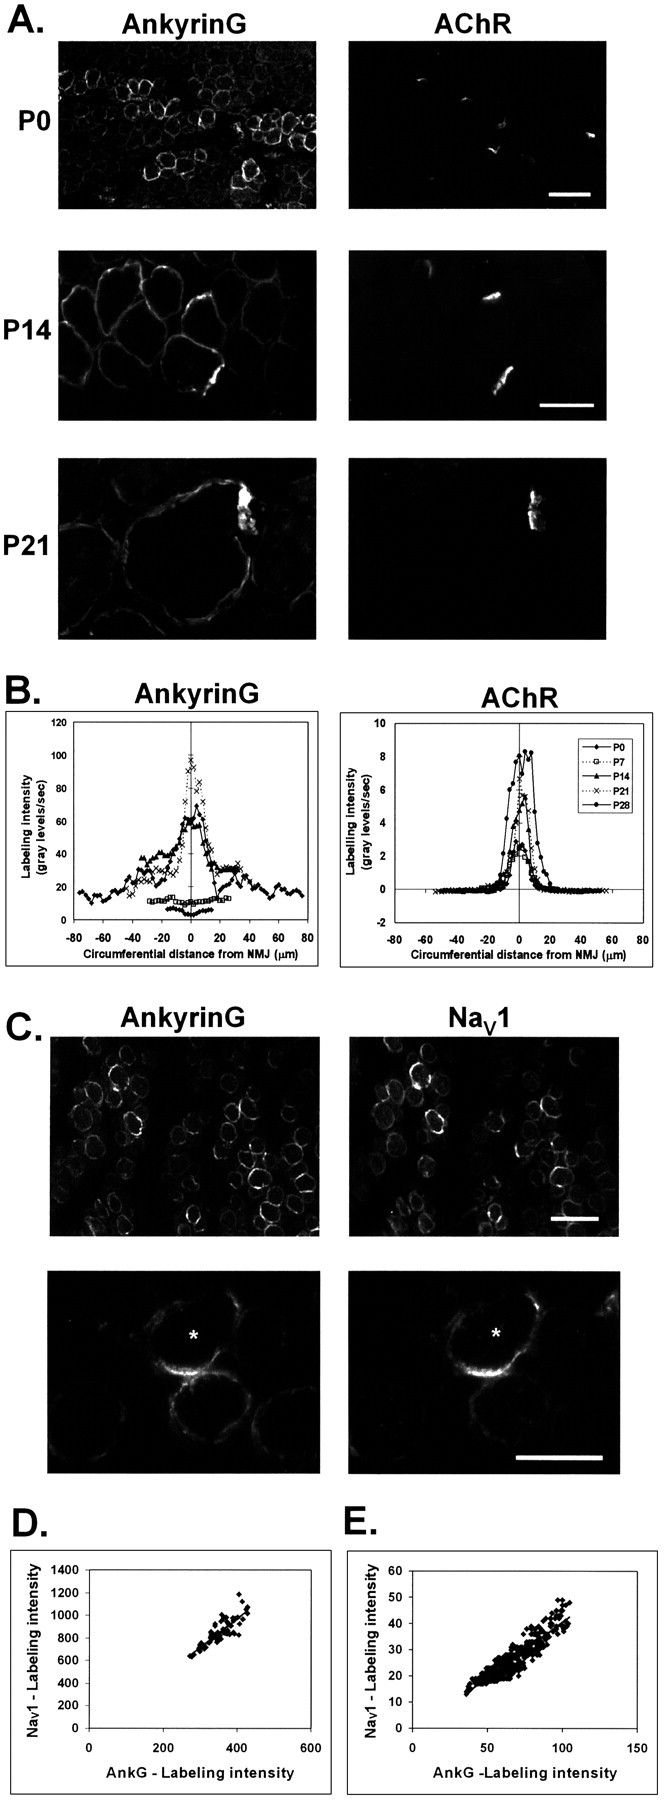
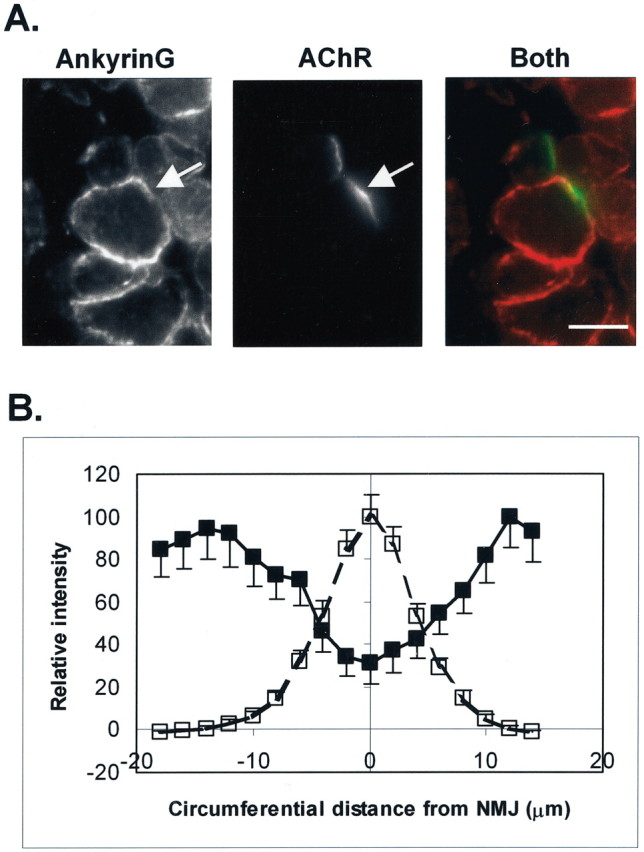
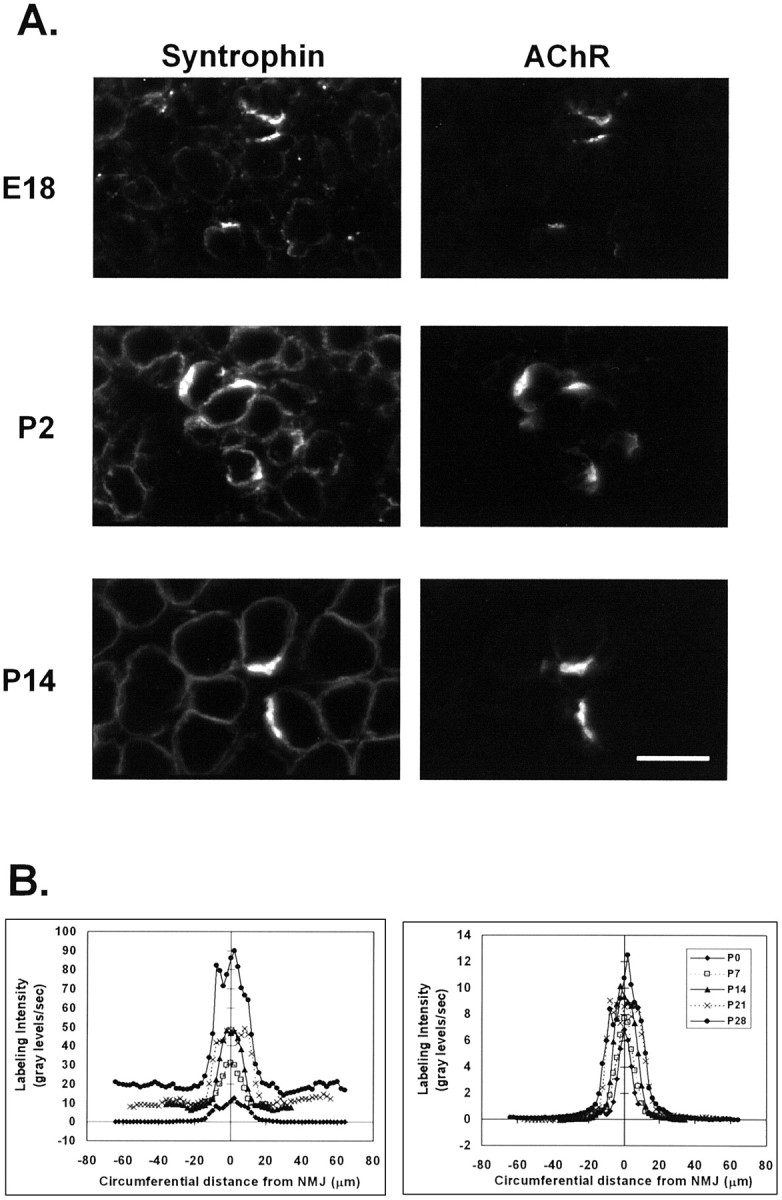
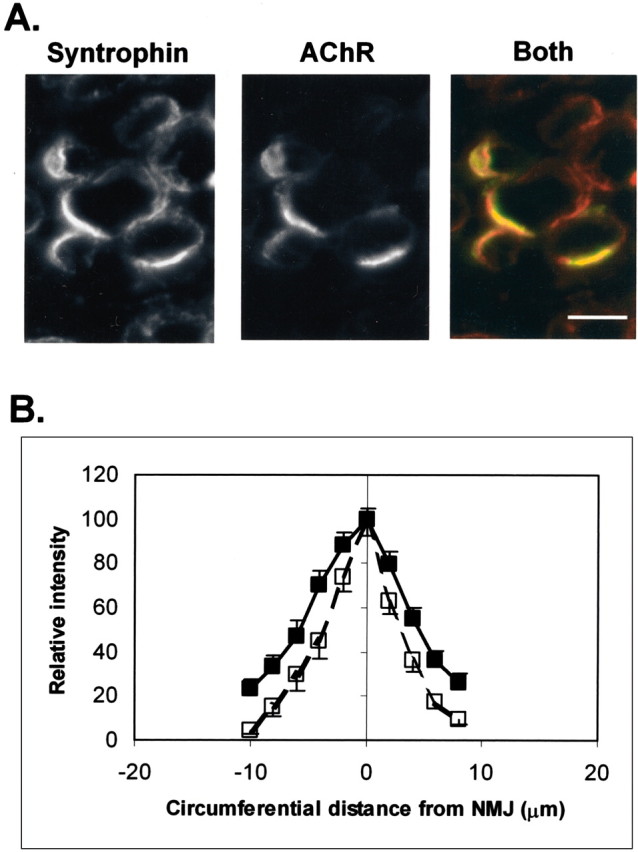
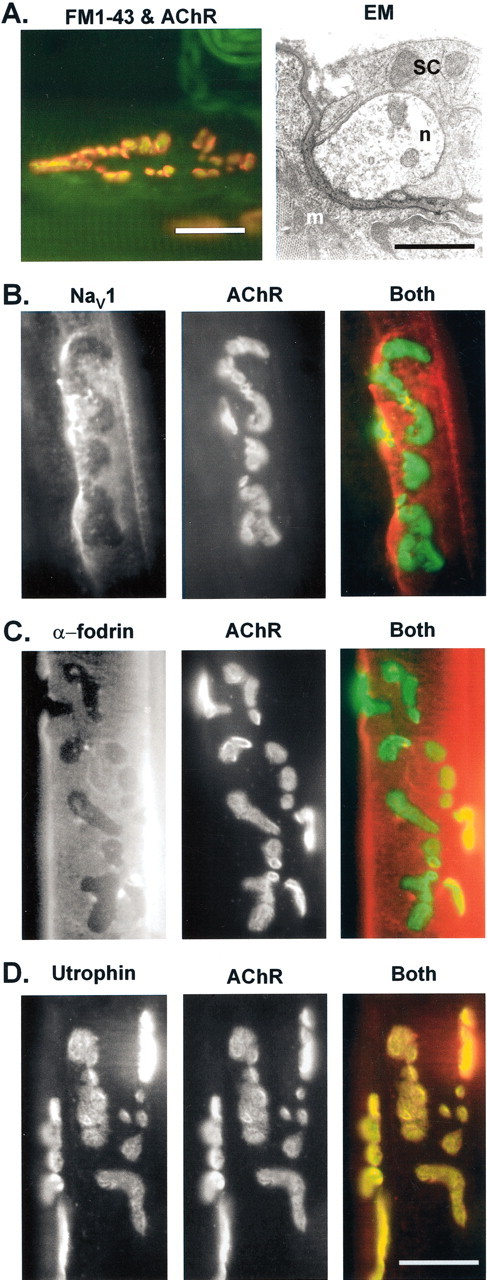
Spatial segregation of membrane proteins is a feature of many excitable cells. In skeletal muscle, clusters of acetylcholine receptors (AChRs) and voltage-gated sodium channels (Na(V)1s) occupy distinct domains at the neuromuscular junction (NMJ). We used quantitative immunolabeling of developing rat soleus muscles to study the mechanism of ion channel segregation and Na(V)1 clustering at NMJs. When Na(V)1s can first be detected, at birth, they already occupy a postsynaptic domain that is distinct from that occupied by AChRs. At this time, Na(V)1s are expressed only in a diffuse area that extends 50-100 microm from the immature NMJ. However, in the region of the high-density AChR cluster at NMJ itself, Na(V)1s are actually present in lower density than in the immediately surrounding membrane. These distinctive features of the Na(V)1 distribution at birth are closely correlated with the distribution of ankyrinG immunolabeling. This suggests that an interaction with ankyrinG plays a role in the initial segregation of Na(V)1s from AChRs. Both Na(V)1 and ankyrinG become clustered at the NMJ itself 1-2 weeks after birth, coincident with the formation of postsynaptic folds. Syntrophin immunolabeling codistributes with AChRs and never resembles that for Na(V)1 or ankyrinG. Therefore, syntrophin is unlikely to play an important part in the initial accumulation of Na(V)1 at the NMJ. These findings suggest that the segregation of Na(V)1 from AChRs begins early in NMJ formation and occurs as a result of the physical exclusion of Na(V)1 and ankyrinG from the region of nerve-muscle contact rather than by a process of active clustering.


Figures

Fig. 1.
Fig. 1.
Distribution of NaV1, ankyrinG, and syntrophin in soleus muscles from newborn rats. AChRs are tightly clustered at the NMJs but undetectable elsewhere. NaV1 and ankyrinG are increased within ∼100 μm of the NMJs but are not tightly clustered. Syntrophin is present in the surface membrane all along the muscle fibers and is particularly concentrated at the NMJs in a region corresponding to the AChR cluster. Scale bar, 100 μm.
Fig. 2.
Fig. 2.
Changes in NaV1 distribution during development of rat soleus muscles. NaV1 is labeled by an antibody that recognizes all NaV1 isoforms. AChRs are labeled by α-BgTx. A, NMJs viewed en face in teased fiber preparations show little clustering of NaV1 in the region of high AChR density until 1–2 weeks after birth.B, Transverse sections reveal increased NaV1 labeling in the region of innervation at P0, but this labeling is not closely colocalized with the AChRs. Some fibers are strongly labeled although no AChR cluster is present (asterisk). At later postnatal stages, NaV1 labeling becomes concentrated at the NMJ and persists in the perijunctional region. C, Circumferential distributions of AChR and NaV1 labeling measured around muscle fiber profiles passing through the NMJ (see Materials and Methods, mean intensity of 12–14 muscle fibers) confirm that, in contrast to AChRs, no increase in NaV1 labeling is seen at the NMJ until P14. D, Quantification of NaV1 labeling in serial transverse sections through the central innervated region of the muscle allows the longitudinal extent of NaV1 distribution in individual muscle fibers to be determined (see Materials and Methods, mean profile of nine muscle fibers). The longitudinal extent of AChR labeling of individual NMJs is rarely >10–15 μm at this age. Scale bar: A, B, 20 μm.
Fig. 3.
Fig. 3.
Labeling for NaV1 channels is reduced in AChR-rich regions of NMJs in newborn rats. A, Example of a muscle fiber profile in which the intensity of NaV1 labeling appears reduced in the region of highest AChR labeling (arrows). NaV1 (red) and AChR (green) labeling are superimposed in the image labeled Both. Scale bar, 20 μm.B, Quantification of the variation in labeling intensity around the circumference of muscle fibers, centered on the NMJ, for NaV1 and AChR. Means ± SEM of data from 12 muscle fibers are shown.
Fig. 4.
Fig. 4.
AnkyrinG distribution at developing rat NMJs.A, At P0, labeling of ankyrinG is broadly increased in the region of the muscle containing NMJs but is not obviously clustered with the AChRs. By P14, ankyrinG labeling is increased at the NMJ.B, Circumferential distributions of AChR and ankyrinG labeling measured along profiles of muscle fibers passing through the NMJ (see Materials and Methods). Means ± SEM of data from 32 to 86 muscle fibers are shown (mean, 55). Note that, as for NaV1, there is no clear increase in ankyrinG at the NMJ until P14. C, Double-immunolabeling of transverse sections shows that the distribution of NaV1 and ankyrinG is strikingly similar in muscles at P0. At the higher magnification, it can be seen that within individual fibers, there is a similar correspondence of labeling. D, Correlation plot of mean intensity of NaV1 labeling versus ankyrinG labeling for 65 muscle fibers. E, Correlation plot of the intensity of labeling of NaV1 and ankyrinG at individual points around the perimeter of the marked fiber (asterisk) inC. Scale bars: A, 50 μm;C, 20 μm.
Fig. 5.
Fig. 5.
AnkyrinG labeling is reduced in AChR-rich regions of NMJs in newborn rats. A, Example of a muscle fiber profile in which the intensity of ankyrinG labeling appears reduced in the region of highest AChR labeling (arrows). AnkyrinG (red) and AChR (green) labeling are superimposed in the image labeled Both.B, Quantification of the variation in labeling intensity around the circumference of muscle fibers, centered on the NMJ, for ankyrinG and AChR. Means ± SEM of data from 49 muscle fibers are shown. Scale bar, 20 μm.
Fig. 6.
Fig. 6.
Syntrophin labeling is increased in AChR-rich domains of NMJs in rats from before birth. A, At E18 and throughout postnatal development, syntrophin labeling is present around muscle fibers and is markedly increased at the NMJ. Scale bar, 20 μm. B, Circumferential distributions of AChR and syntrophin labeling measured around muscle fiber profiles (see Materials and Methods) (mean labeling intensity of 11–25; mean, 15 fibers) confirms that syntrophin and AChR are increased at the NMJ, whereas only syntrophin is increased in nonjunctional membrane.
Fig. 7.
Fig. 7.
Syntrophin is increased in density in AChR-rich regions of NMJs in newborn rats. A, At high magnification, the close correspondence of syntrophin and AChR labeling can be seen. Syntrophin (red) and AChR (green) labeling overlap (yellow) in the superimposed image labeledBoth. Scale bar, 20 μm. B, Quantification of the variation in labeling intensity around the circumference of muscle fibers, centered on the NMJ, for syntrophin and AChR. Means ± SEM of data from 25 muscle fibers are shown.
Fig. 8.
Fig. 8.
NMJs in young adult chicken ambiens muscle.A, Nerve terminals (green) labeled with FM1–43 and AChRs (red) labeled with α-BgTx reveal that the overall organization of the chicken NMJ is similar to that in mammals (left). Electron microscopy (EM) reveals the absence of postsynaptic folds (right; n, Nerve terminal;SC, Schwann cell; m, muscle fiber).B–D, Teased fiber preparations allow NMJs to be vieweden face. In the region of high AChR density, the density of labeling for NaV1 (B) and α-fodrin is low (C), whereas that for utrophin is high (D). Scale bars: A, left, 25 μm; A, right, 1 μm; (in D), B–D, 20 μm.

Similar articles

Cited by

References

    1. Adams ME, Mueller HA, Froehner SC. In vivo requirement of the α-syntrophin PDZ domain for the sarcolemmal localization of nNOS and aquaporin-4. J Cell Biol. 2001;155:113–122. - PMC - PubMed
    1. Angelides KJ, Elmer LW, Loftus D, Elson E. Distribution and lateral mobility of voltage-dependent sodium channels in neurons. J Cell Biol. 1988;106:1911–1925. - PMC - PubMed
    1. Awad SS, Buckel A, Lightowlers RN, Lømo T, Stocksley MA, Wood SJ, Young C, Slater CR. Accumulation of voltage-gated sodium channels at rat neuromuscular junctions. Soc Neurosci Abstr. 1999;25:1021.
    1. Awad SS, Lightowlers RN, Young C, Chrzanowska-Lightowlers ZM, Lomo T, Slater CR. Sodium channel mRNAs at the neuromuscular junction: distinct patterns of accumulation and effects of muscle activity. J Neurosci. 2001;21:8456–8463. - PMC - PubMed
    1. Berghs S, Aggujaro D, Dirkx R, Jr, Maksimova E, Stabach P, Hermel JM, Zhang JP, Philbrick W, Slepnev V, Ort T, Solimena M. βIV spectrin, a new spectrin localized at axon initial segments and nodes of ranvier in the central and peripheral nervous system. J Cell Biol. 2000;151:985–1002. - PMC - PubMed

Publication types

LinkOut - more resources