

Resting potential and submembrane calcium concentration of inner hair cells in the isolated mouse cochlea are set by KCNQ-type potassium channels
- PMID: 12657673
- PMCID: PMC6742048
- DOI: 10.1523/JNEUROSCI.23-06-02141.2003
Resting potential and submembrane calcium concentration of inner hair cells in the isolated mouse cochlea are set by KCNQ-type potassium channels
Abstract
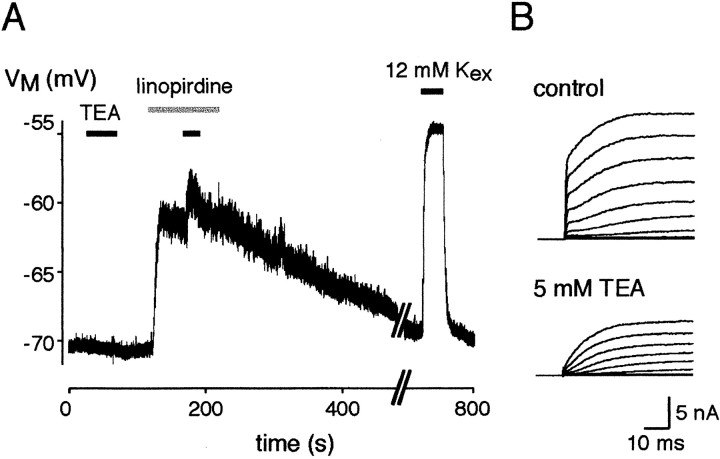
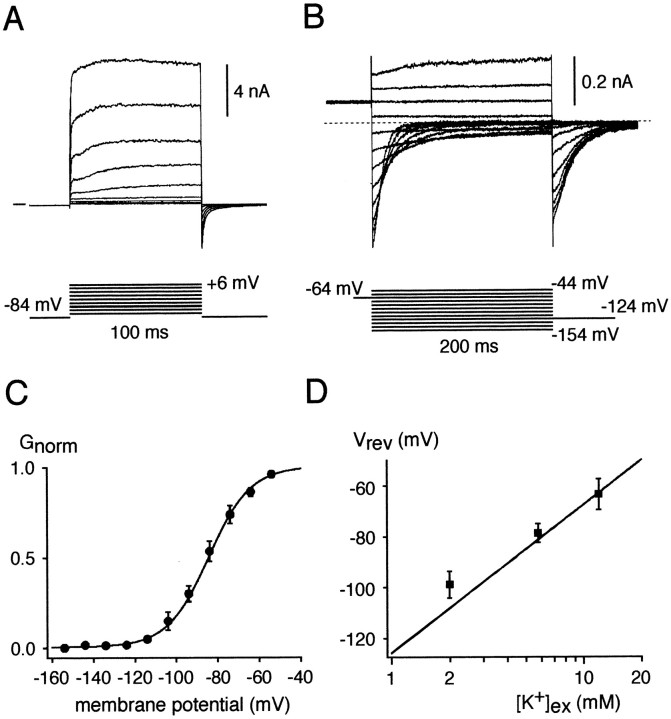
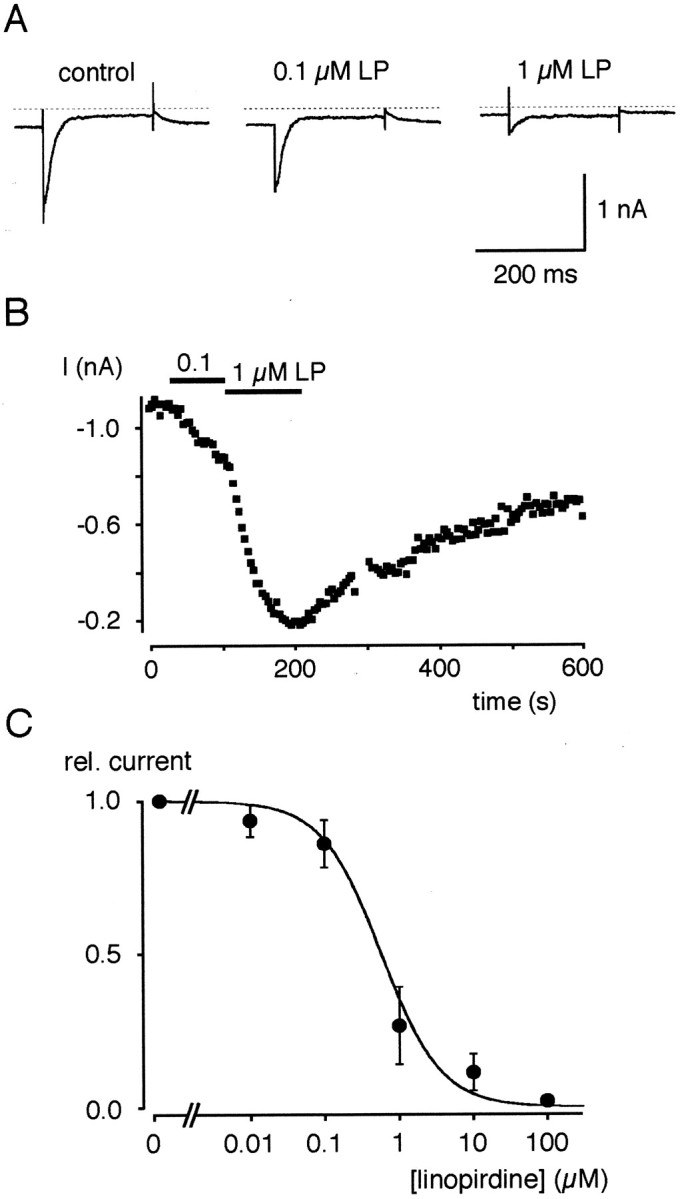
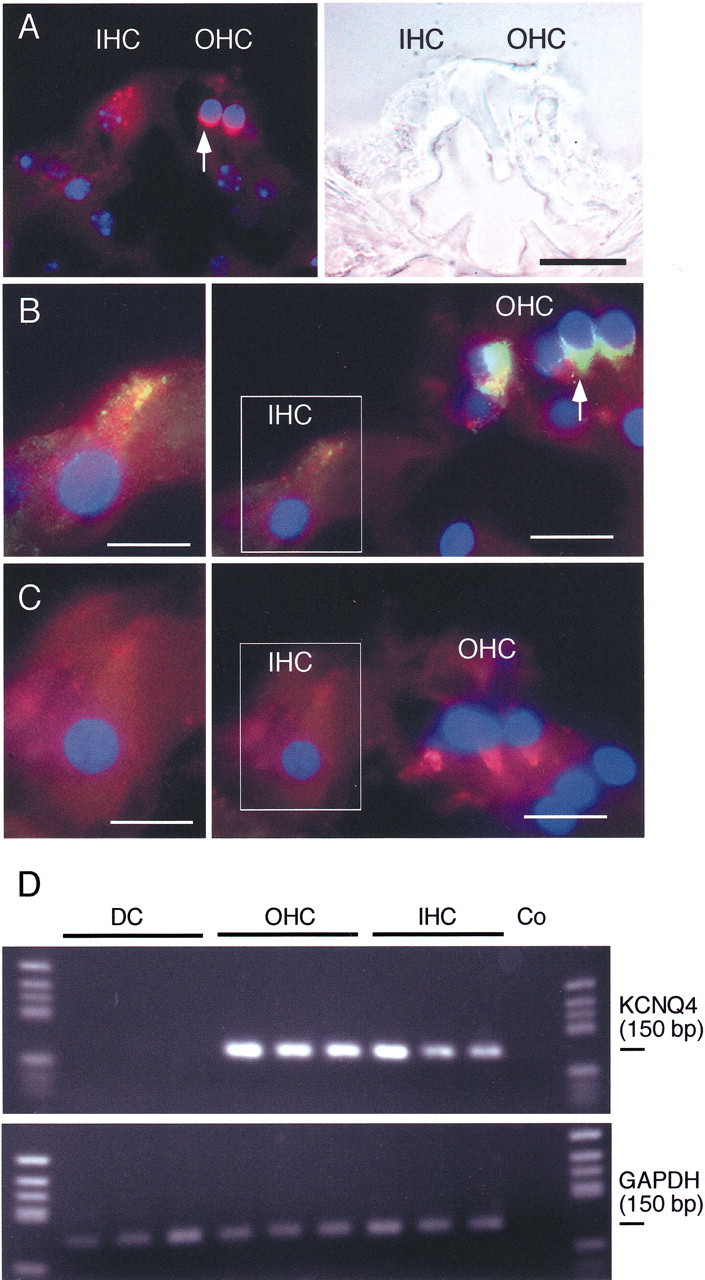
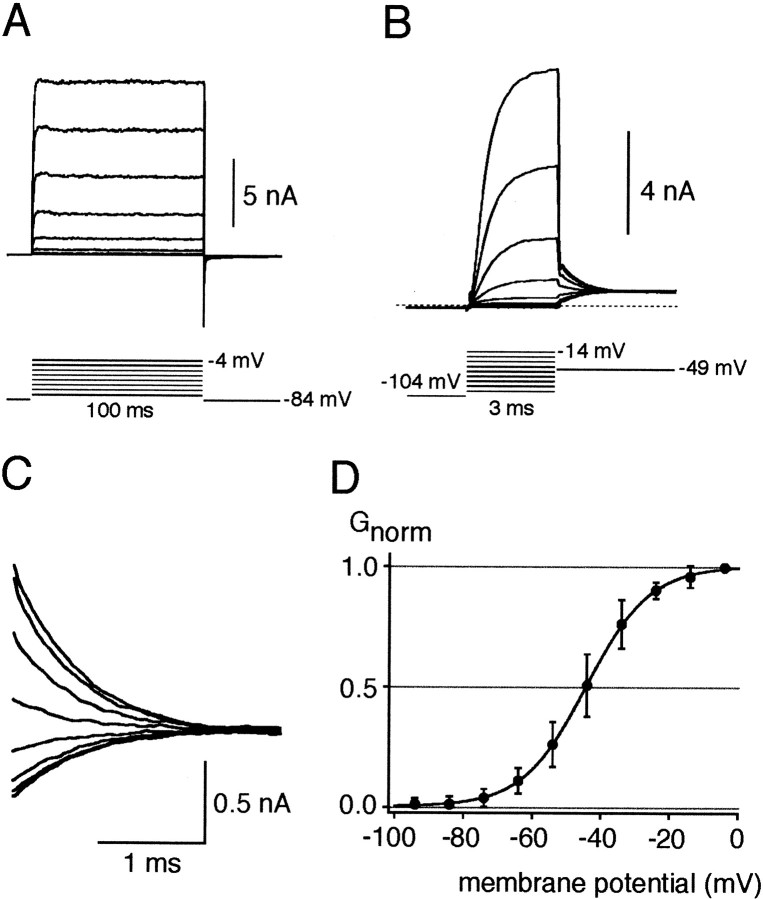
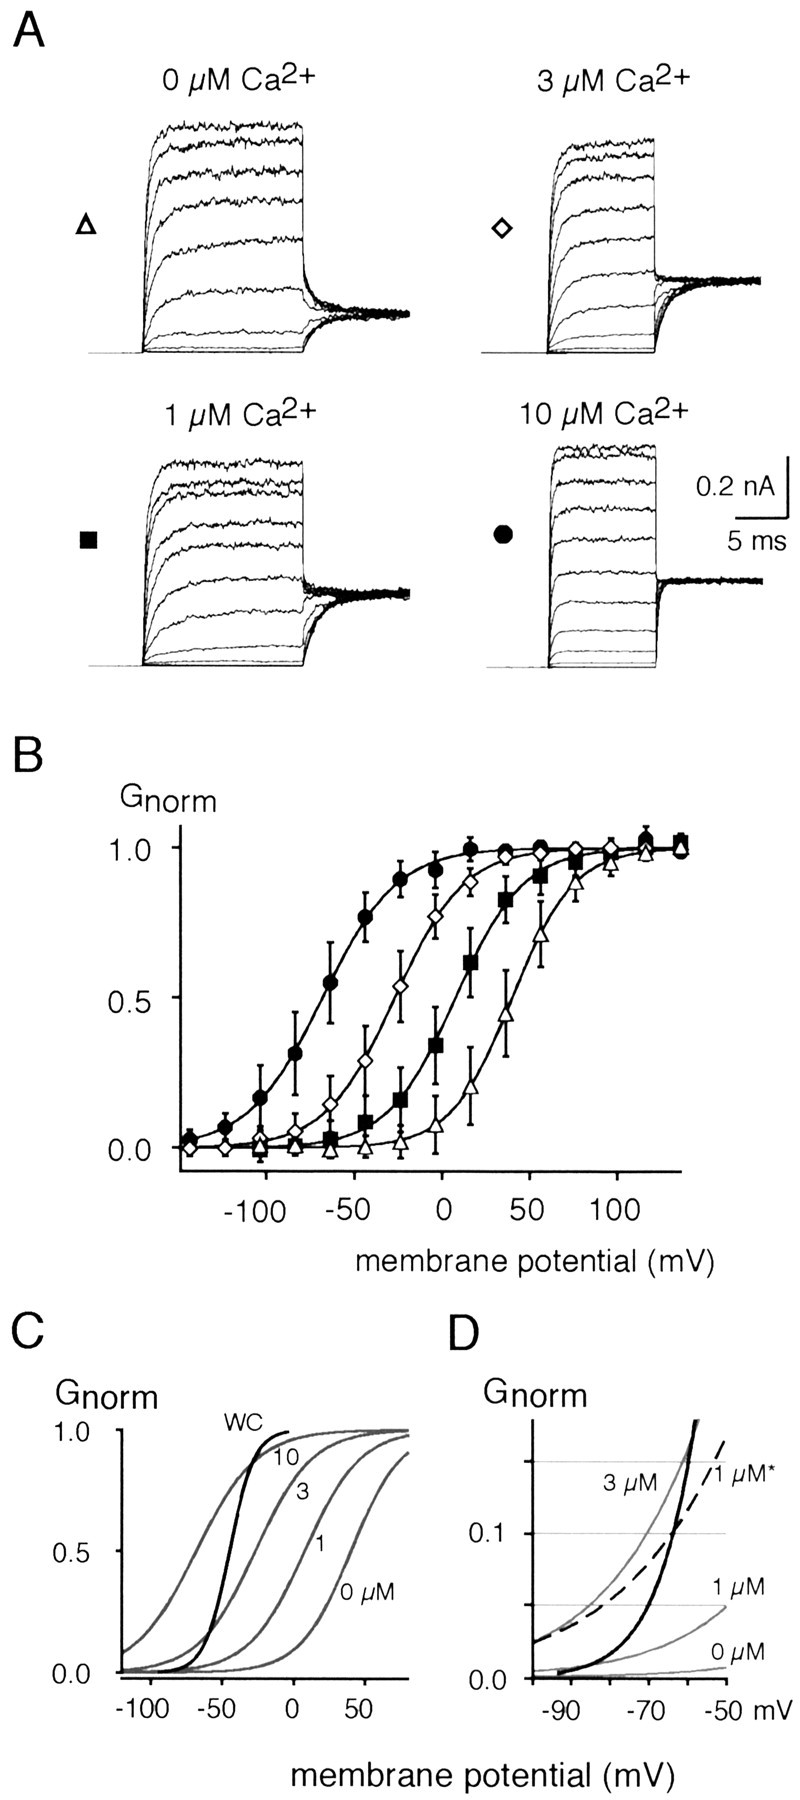
Cochlear inner hair cells (IHCs) transduce sound-induced vibrations into a receptor potential (RP) that controls afferent synaptic activity and, consequently, frequency and timing of action potentials in the postsynaptic auditory neurons. The RP is thought to be shaped by the two voltage-dependent K+ conductances, I(K,f) and I(K,s), that are carried by large-conductance Ca2+- and voltage-dependent K+ (BK)- and K(V)-type K+ channels. Using whole-cell voltage-clamp recordings in the acutely isolated mouse cochlea, we show that IHCs display an additional K+ current that is active at the resting membrane potential (-72 mV) and deactivates on hyperpolarization. It is potently blocked by the KCNQ-channel blockers linopirdine and XE991 but is insensitive to tetraethylammonium and 4-aminopyridine, which inhibit I(K,f) and I(K,s), respectively. Single-cell PCR and immunocytochemistry showed expression of the KCNQ4 subunit in IHCs. In current-clamp experiments, block of the KCNQ current shifted the resting membrane potential by approximately 7 to -65 mV and led to a significant activation of BK channels. Using BK channels as an indicator for submembrane intracellular Ca2+ concentration ([Ca2+]i), it is shown that the shift in IHC resting potential observed after block of the KCNQ channels leads to an increase in [Ca2+]i to values > or =1 microm. In conclusion, KCNQ channels set the resting membrane potential of IHCs in the isolated organ of Corti and thus maintain [Ca2+]i at low levels. Destabilization of the resting potential and increase in [Ca2+]i, as may result from impaired KCNQ4 function in IHCs, provide a novel explanation for the progressive hearing loss (DFNA2) observed in patients with defective KCNQ4 genes.
Figures
Similar articles
-
Property of I(K,)(n) in inner hair cells isolated from guinea-pig cochlea.Hear Res. 2010 Mar;261(1-2):57-62. doi: 10.1016/j.heares.2010.01.002. Epub 2010 Jan 12. Hear Res. 2010. PMID: 20060884
-
CaV1.3 channels are essential for development and presynaptic activity of cochlear inner hair cells.J Neurosci. 2003 Nov 26;23(34):10832-40. doi: 10.1523/JNEUROSCI.23-34-10832.2003. J Neurosci. 2003. PMID: 14645476 Free PMC article.
-
Effects of intracellular stores and extracellular Ca(2+) on Ca(2+)-activated K(+) currents in mature mouse inner hair cells.J Physiol. 2004 Jun 1;557(Pt 2):613-33. doi: 10.1113/jphysiol.2003.060137. Epub 2004 Apr 2. J Physiol. 2004. PMID: 15064328 Free PMC article.
-
How to build an inner hair cell: challenges for regeneration.Hear Res. 2007 May;227(1-2):3-10. doi: 10.1016/j.heares.2006.12.005. Epub 2006 Dec 16. Hear Res. 2007. PMID: 17258412 Review.
-
Mechanisms of hair cell tuning.Annu Rev Physiol. 1999;61:809-34. doi: 10.1146/annurev.physiol.61.1.809. Annu Rev Physiol. 1999. PMID: 10099711 Review.
Cited by
-
Deletion of the Ca2+-activated potassium (BK) alpha-subunit but not the BKbeta1-subunit leads to progressive hearing loss.Proc Natl Acad Sci U S A. 2004 Aug 31;101(35):12922-7. doi: 10.1073/pnas.0402660101. Epub 2004 Aug 24. Proc Natl Acad Sci U S A. 2004. PMID: 15328414 Free PMC article.
-
Spontaneous and Acetylcholine Evoked Calcium Transients in the Developing Mouse Utricle.Front Cell Neurosci. 2019 May 7;13:186. doi: 10.3389/fncel.2019.00186. eCollection 2019. Front Cell Neurosci. 2019. PMID: 31133810 Free PMC article.
-
Dominant-negative inhibition of M-like potassium conductances in hair cells of the mouse inner ear.J Neurosci. 2007 Aug 15;27(33):8940-51. doi: 10.1523/JNEUROSCI.2085-07.2007. J Neurosci. 2007. PMID: 17699675 Free PMC article.
-
Calcium-induced calcium release in proximity to hair cell BK channels revealed by PKA activation.Physiol Rep. 2020 Aug;8(15):e14449. doi: 10.14814/phy2.14449. Physiol Rep. 2020. PMID: 32748549 Free PMC article.
-
Kv7-type channel currents in spiral ganglion neurons: involvement in sensorineural hearing loss.J Biol Chem. 2010 Nov 5;285(45):34699-707. doi: 10.1074/jbc.M110.136192. Epub 2010 Aug 25. J Biol Chem. 2010. PMID: 20739290 Free PMC article.
References
-
- Adelman JP, Shen KZ, Kavanaugh MP, Warren RA, Wu YN, Lagrutta A, Bond CT, North RA. Calcium-activated potassium channels expressed from cloned complementary DNAs. Neuron. 1992;9:209–216. - PubMed
-
- Beisel KW, Nelson NC, Delimont DC, Fritzsch B. Longitudinal gradients of KCNQ4 expression in spiral ganglion and cochlear hair cells correlate with progressive hearing loss in DFNA2. Brain Res Mol Brain Res. 2000;82:137–149. - PubMed
-
- Brenner R, Jegla TJ, Wickenden A, Liu Y, Aldrich RW. Cloning and functional characterization of novel large conductance calcium-activated potassium channel beta subunits, hKCNMB3 and hKCNMB4. J Biol Chem. 2000;275:6453–6461. - PubMed
-
- Coucke P, Van Camp G, Djoyodiharjo B, Smith SD, Frants RR, Padberg GW, Darby JK, Huizing EH, Cremers CW, Kimberling WJ, Oostra BA, Vandeheyning PH, Willems PJ. Linkage of autosomal dominant hearing loss to the short arm of chromosome 1 in two families. N Engl J Med. 1994;331:425–431. - PubMed
Publication types
MeSH terms
Substances
LinkOut - more resources
Full Text Sources
Molecular Biology Databases
Miscellaneous