. 2003 Mar 15;23(6):2218-27.
doi: 10.1523/JNEUROSCI.23-06-02218.2003.

Overlapping microarray profiles of dentate gyrus gene expression during development- and epilepsy-associated neurogenesis and axon outgrowth

Affiliations

Overlapping microarray profiles of dentate gyrus gene expression during development- and epilepsy-associated neurogenesis and axon outgrowth

Robert C Elliott et al. J Neurosci. .

Abstract

Neurogenesis and axon outgrowth are features shared by normal nervous system development and certain forms of epileptogenesis. This observation has led to the hypothesis that some aspects of normal development and epileptogenesis have common molecular mechanisms. To test this hypothesis, we have used DNA microarray analysis to characterize gene expression in the dentate gyrus and identify genes exhibiting similar patterns of regulation during development and epileptogenesis. Of more than 8000 sequences surveyed, over 600 were regulated during development or epileptogenesis, and 37 of these were either upregulated or downregulated during both processes. In situ hybridization analysis of a subset of these "commonality genes" confirmed the patterns of regulation predicted by the microarray data in most cases and demonstrated various spatial and temporal patterns of commonality gene expression. Of the 25 named commonality genes in which some functional characteristics are known, 11 have been implicated in cell morphology and axon outgrowth or cellular proliferation and fate determination. This enrichment for candidate plasticity-related genes supports the concept that developmental mechanisms contribute to network alterations associated with epileptogenesis and offers a useful strategy for identifying molecules that may play a role in both of these processes.


Figures

Fig. 1.
Fig. 1.
Scattergram analysis of microarray data. Average difference (AD) measures of gene expression for each of the 2680 detectable sequences on the microarray were plotted to yield scattergrams similar to the representative examples shown here. The high degree of correlation of AD values from two independent naive adult dentate gyrus cRNA samples reflects the accuracy of gene expression data derived from the DNA microarrays (top panel). Greater scattering in development and epileptogenesis samples is indicative of differential gene expression during those processes (middle and bottom panels). Light lines on either side of thedarker line of equality indicate twofold changes in mRNA levels.
Fig. 2.
Fig. 2.
Clustergraph analysis of gene regulation. A hierarchical clustering analysis of S-score gene expression data from three epileptogenic comparisons (SE lanes) and four developmental comparisons (DEV lanes) along with four control comparisons (CON lanes) is depicted. Red bands indicate increased gene expression after SE or during development, and green bands indicate decreased gene expression. A large cluster of genes downregulated during both development and epileptogenesis is most apparent; however, smaller subclusters of genes dissimilarly regulated are also evident, as is a separate cluster of genes upregulated during epileptogenesis that are unaffected during development. In CON lanes,red or green bands indicate increased or decreased gene expression between two identical samples.
Fig. 3.
Fig. 3.
Functional distribution of genes regulated during development and epileptogenesis. Significantly regulated genes were categorized into 1 of 11 functional groups on the basis of their previous descriptions in the literature; EST sequences were not included. Note the overall wide distribution of gene functions across both groups. a, Metabolism-related genes compose a significant fraction of genes upregulated during development (yellow bars), and injury/survival-related genes are highly upregulated after SE (blue bars).b, Genes downregulated during development or epileptogenesis are distributed more evenly across numerous functional categories, with a slight predominance of metabolic and signaling genes during development (yellow bars) and metabolic, morphology, and extracellular signaling genes during epileptogenesis (blue bars). However, morphology-related, calcium homeostasis-related, and cell cycle/fate-related genes are the categories most frequently regulated during both development and epileptogenesis (a, b,green bars).
Fig. 4.
Fig. 4.
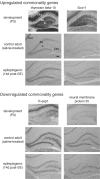
In situ characterization of commonality gene expression in developing, normal adult, and epileptogenic adult dentate gyrus. In situ mRNA analysis of 17 representative commonality genes (including 8 EST clusters) from multiple functional categories was performed to characterize cellular patterns of gene expression and verify DNA microarray regulatory data. Examples of “true positive” upregulated commonality genes, with higher levels of expression in dentate gyrus tissue sections from P3 and 14 d post-SE animals as compared with adult control, are shown in top half of figure. Note diffuse labeling for thymosin β-10 and Sox11 mRNAs throughout developing dentate gyrus at P3 that is accentuated in the adult DGC layer, with the most prominent signal in the neurogenic SGZ. Examples of true positive downregulated commonality genes, with mRNA levels that are downregulated during development and epileptogenesis, are shown in the bottom half of the figure. At P3, R-esp1 and neural membrane protein 35 expression are relatively light and more limited within the formative DGC layer, most likely in more mature cells, in keeping with the greater levels of expression in the adult. The degree of upregulation or downregulation of commonality gene expression during epileptogenesis ranged from slight (e.g., Sox11,top) to large (e.g., R-esp 1,bottom). CA1, Corpus ammon 1 pyramidal cell layer; CA3, corpus ammon 3 pyramidal cell layer;dg, dentate gyrus; h, hilus. Scale bar, 100 μm.
Fig. 5.
Fig. 5.
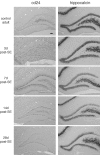
In situ analysis of commonality gene expression over 28 d time course of epileptogenesis.In situ analysis of selected commonality genes was conducted over a broader time course of epileptogenesis. Various spatial and temporal patterns of gene expression and regulation were observed. For example, CD24 mRNA was prominently expressed in the SGZ of the dentate gyrus (other than a more global induction at 3 d post-SE that appears to be in glia and is relatively short-lived) and increased acutely after SE (left), whereas hippocalcin mRNA was more broadly expressed throughout the dentate gyrus and exhibited a more prolonged decrease that was greatest in the more mature regions of the cell layer (right). Scale bar, 100 μm.

References

    1. Altman J, Bayer SA. Migration and distribution of two populations of hippocampal granule cell precursors during the perinatal and postnatal periods. J Comp Neurol. 1990;301:365–381. - PubMed
    1. Altman J, Das GD. Autoradiographic and histological evidence of postnatal hippocampal neurogenesis in rats. J Comp Neurol. 1965;124:319–335. - PubMed
    1. Baraban SC, Hollopeter G, Erickson JC, Schwartzkroin PA, Palmiter RD. Knock-out mice reveal a critical antiepileptic role for neuropeptide Y. J Neurosci. 1997;17:8927–8936. - PMC - PubMed
    1. Bayer SA. Development of the hippocampal region in the rat. I. Neurogenesis examined with 3H-thymidine autoradiography. J Comp Neurol. 1980;190:87–114. - PubMed
    1. Braunewell KH, Gundelfinger ED. Intracellular neuronal calcium sensor proteins: a family of EF-hand calcium-binding proteins in search of a function. Cell Tissue Res. 1999;295:1–12. - PubMed

Publication types

MeSH terms