Comparative Study
. 2003 Mar 15;23(6):2477-87.
doi: 10.1523/JNEUROSCI.23-06-02477.2003.

The Edinger-Westphal-lateral septum urocortin pathway and its relationship to alcohol consumption

Affiliations
Comparative Study

The Edinger-Westphal-lateral septum urocortin pathway and its relationship to alcohol consumption

Ryan K Bachtell et al. J Neurosci. .

Abstract

Identifying and characterizing brain regions regulating alcohol consumption is beneficial for understanding the mechanisms of alcoholism. To this aim, we first identified brain regions changing in expression of the inducible transcription factor c-Fos in the alcohol-preferring C57BL/6J (B6) and alcohol-avoiding DBA/2J (D2) mice after ethanol consumption. Drinking a 5% ethanol/10% sucrose solution in a 30 min limited access procedure led to induction of c-Fos immunoreactivity in urocortin (Ucn)-positive cells of the Edinger-Westphal nucleus (EW), suppression of c-Fos immunoreactivity in the dorsal portion of the lateral septum (LS) of both strains of mice, and strain-specific suppression in the intermediate portion of the LS and the CA3 hippocampal region. Because the EW sends Ucn projections to the LS, and B6 and D2 mice differ dramatically in EW Ucn expression, we further analyzed the Ucn EW-LS pathway using several genetic approaches. We find that D2 mice have higher numbers of Ucn-immunoreactive processes than B6 mice in the LS and that consumption of ethanol/sucrose in the F2 offspring of a B6D2 intercross positively correlates with Ucn immunoreactivity in the EW and negatively correlates with Ucn immunoreactivity in the LS. In agreement with these findings, we find that alcohol-avoiding male B6.D2 Alcp1 line 2.2 congenic mice have lower Ucn immunoreactivity in the EW than male B6.B6 mice. Finally, we also find that HAP mice, selectively bred for high alcohol preference, have higher Ucn immunoreactivity in EW, than LAP mice, selectively bred for low alcohol preference. Taken together, these studies provide substantial evidence for involvement of the EW-LS Ucn pathway in alcohol consumption.


Figures
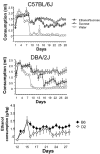
Fig. 1.
Fig. 1.
Consumption patterns of D2 (top) and B6 (middle) mice during the entire 30 min limited access procedure. On days 1–10, fluid access times were gradually decreased from 2 hr to 30 min during the test session. These changes were concurrent with gradual decreases in overall fluid deprivation (22 hr to 2 hr without access to fluid). On day 11, all mice except the water group were given 10% sucrose for 30 min. Alcohol was first introduced on day 13 at a 2% concentration in 10% sucrose, which was subsequently increased to 5% ethanol in 10% sucrose on day 15. Analysis of the significant group × strain interaction reveals differences between the strains in consumption levels of the ethanol/sucrose group (p < 0.001), but not sucrose or water. The bottom panel shows a strain comparison of ethanol consumption (grams per kilogram) during the 30 min limited access session. As expected, B6 mice consume more ethanol that D2 mice (p < 0.001).
Fig. 2.
Fig. 2.
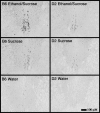
Consumption of the ethanol/sucrose solution significantly elevates c-Fos expression in the EW in B6 and D2 mice. Induction was significantly lower in the D2 versus the B6 strain.
Fig. 3.
Fig. 3.
The following four subregions (A) of the lateral septum were analyzed and compared between the B6 and D2 strains: D, dorsal;V, ventral; IM, intermediate medial;IL, intermediate lateral. Statistical analysis of Ucn processes in the LS of B6 and D2 mice revealed a significant main effect of strain, in which D2 mice have higher numbers of processes than B6 mice (B). Note the architectural nature of the Ucn-positive processes in LS at 100× (C) and 1000× (D) magnification.
Fig. 4.
Fig. 4.
Frequency distributions of B6D2 F2 intercross mice during the continuous two-bottle choice procedure (two left panels) and the 30 min limited access ethanol/sucrose procedure (right panel). The left panelcorresponds to total consumption of the ethanol solution at 3% (top), 6% (middle), and 10% (bottom) concentrations. The middle panelcorresponds to preference ratio (ethanol consumed/total fluid consumed) at the 3% (top), 6% (middle), and 10% (bottom) concentrations. Note the skewed distributions in both consumption and preference in the 24 hr two-bottle procedure. The tendencies to not drink in this procedure may have limited the ability to detect significant relationships with Ucn expression. Theright panel corresponds to the consumption of a 3% ethanol/10% sucrose (top), 6% ethanol/10% sucrose (middle), and 10% ethanol/10% sucrose (bottom).
Fig. 5.
Fig. 5.
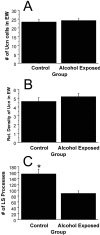
Consumption of ethanol in the B6D2 F2 mice appeared to have no effect on the number of Ucn-positive cells (A) or expression of Ucn in EW (B), but had significant suppressive effects on the number of Ucn-positive processes in the LS (C). *Significant difference from corresponding group (p < 0.001).
Fig. 6.
Fig. 6.
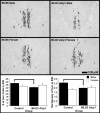
Analysis of the EW in the B6.D2Alcp1 line 2.2 congenic and B6.B6 mice revealed differing levels of Ucn expression (top panels). Quantification revealed that male B6.D2 Alcp1 line 2.2 mice possess significantly lower numbers of Ucn-positive cells than the control B6.B6 males (p < 0.05; indicated with bar), whereas females of the two strains did not differ (bottom left panel). Likewise, significantly lower expression levels were observed in the male B6.D2Alcp1 line 2.2 mice (p < 0.005; indicated with bar) but not in the female mice (bottom right panel). No comparisons were made between male and female mice because the sections from each sex were processed separately. Separately processed sections show variability in the intensity of signals and therefore may skew quantitative comparison.
Fig. 7.
Fig. 7.
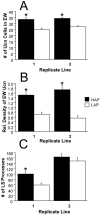
Quantification of Ucn levels in the EW and LS of HAP and LAP mice revealed significant differences between these lines of mice selectively bred for differences in alcohol preference measures. A, Both replicate lines of HAP mice possess more Ucn-positive cells in the EW. B, Similarly, both replicate lines of the HAP mice have higher Ucn expression levels than corresponding LAP mice. C, Analysis of Ucn-positive LS processes revealed significantly larger numbers in the HAP mice of replicate 1 but not of replicate 2. *Significantly different from corresponding line (p < 0.01).

Similar articles

Cited by

References

    1. Bachtell RK, Wang YM, Freeman P, Risinger FO, Ryabinin AE. Alcohol drinking produces brain region-selective changes in expression of inducible transcription factors. Brain Res. 1999;847:157–165. - PubMed
    1. Bachtell RK, Tsivkovskaia NO, Ryabinin AE. Strain differences in urocortin expression in the Edinger-Westphal nucleus and its relation to alcohol-induced hypothermia. Neuroscience. 2002;113:421–434. - PubMed
    1. Belknap JK, Crabbe JC, Young ER. Voluntary consumption of ethanol in 15 inbred mouse strains. Psychopharmacology. 1993;112:503–510. - PubMed
    1. Bittencourt JC, Vaughan J, Arias C, Rissman RA, Vale WW, Sawchenko PE. Urocortin expression in rat brain: evidence against a pervasive relationship of urocortin-containing projections with targets bearing type 2 CRF receptors. J Comp Neurol. 1999;415:285–312. - PubMed
    1. Burde RM, Williams F. Parasympathetic nuclei. Brain Res. 1989;498:371–375. - PubMed

Publication types

MeSH terms