. 2003 Mar-Apr;5(2):135-45.
doi: 10.1016/s1476-5586(03)80005-2.

Contributions of cell metabolism and H+ diffusion to the acidic pH of tumors

Affiliations

Contributions of cell metabolism and H+ diffusion to the acidic pH of tumors

Paul A Schornack et al. Neoplasia. 2003 Mar-Apr.

Abstract

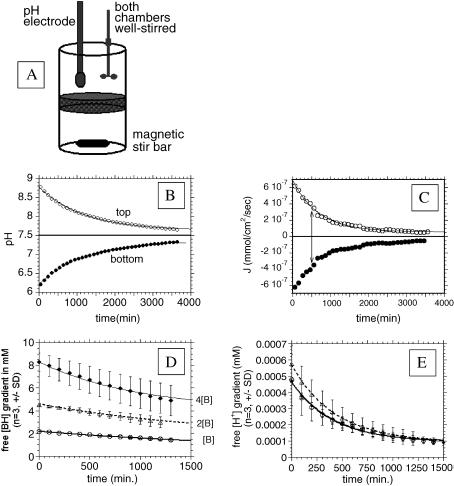
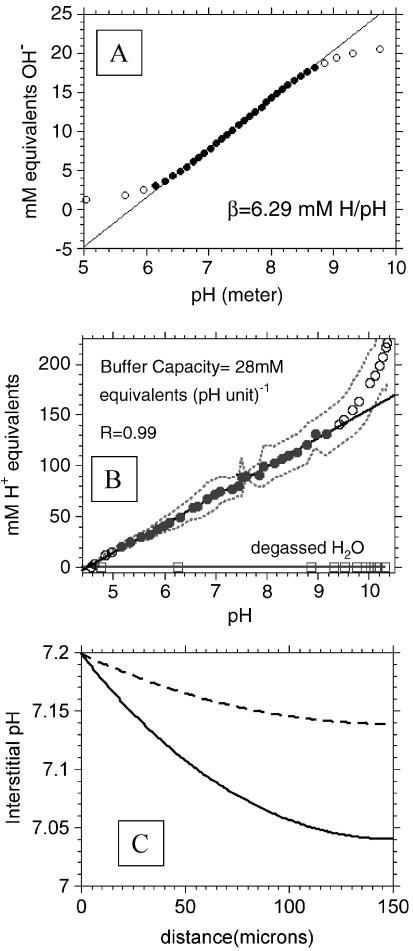
The tumor microenvironment is hypoxic and acidic. These conditions have a significant impact on tumor progression and response to therapies. There is strong evidence that tumor hypoxia results from inefficient perfusion due to a chaotic vasculature. Consequently, some tumor regions are well oxygenated and others are hypoxic. It is commonly believed that hypoxic regions are acidic due to a stimulation of glycolysis through hypoxia, yet this is not yet demonstrated. The current study investigates the causes of tumor acidity by determining acid production rates and the mechanism of diffusion for H(+) equivalents through model systems. Two breast cancer cell lines were investigated with divergent metabolic profiles: nonmetastatic MCF-7/s and highly metastatic MDA-mb-435 cells. Glycolysis and acid production are inhibited by oxygen in MCF-7/s cells, but not in MDA-mb-435 cells. Tumors of MDA-mb-435 cells are significantly more acidic than are tumors of MCF-7/s cells, suggesting that tumor acidity is primarily caused by endogenous metabolism, and not the lack of oxygen. Metabolically produced protons are shown to diffuse in association with mobile buffers, in concordance with previous studies. The metabolic and diffusion data were analyzed using a reaction-diffusion model to demonstrate that the consequent pH profiles conform well to measured pH values for tumors of these two cell lines.


Figures

Figure 1
Figure 1
Determination of pH by phenol red absorption. The concentration of phenol red was 0.1 mM and the path length was 0.62 cm in each case. (A) Absorption versus wavelength spectrum for the deprotonated (pH=11) and protonated (pH=3) forms of phenol red showing maximum absorbance at 550 and 435 nm, respectively. (B) Absorbance of phenol red at 562 nm (●) and 450 nm (◆) as a function of pH. (C) Ratio of phenol red absorption, A(562 nm)/A(450 nm), as a function of pH. (D) Calibration of pH determination by comparing values from potentiometric and phenol red absorption pH determinations. R=0.99 between pH values of 6.0 and 7.5 (filled circles).
Figure 2
Figure 2
Proton production rates. (A) pHe determined with phenol red as a function of time for MDA-mb-435 cells incubated at 37°C and ambient O2 and 0.5, 1, 2, 4, and 8 mM glucose. (B) Proton production rates of MCF-7/s cells under normoxic and anoxic conditions as a function of incubation [glucose] in millimolar (standard error bars range from ±0.2 to 0.5 for normoxic MCF-7/s cells so that they fall within the symbols). (C) Proton production rates of MDA-mb-435 cells under normoxic and anoxic conditions as a function of incubation [glucose] in millimolar. For (B) and (C), lines represent best fits to unimolecular Michaelis-Menten equation.
Figure 3
Figure 3
Lactate production rates. (A) Lactate production as a function of time for MDA-mb-435 cells incubated at 37°C with ambient O2 and 0.5, 1, 2, 4, and 8 mM glucose. (B) Lactate production rates of MCF-7/s cells under normoxic and anoxic conditions as a function of incubation [glucose] in millimolar. (C) Lactate production rates of MDA-mb-435 cells under normoxic and anoxic conditions as a function of incubation [glucose] in millimolar. For all plots, lines represent best fits to simple Michaelis-Menten equation.
Figure 4
Figure 4
Glucose consumption rates. (A) Glucose consumption rates of MCF-7/s cells under normoxic and anoxic conditions as a function of incubation [glucose] in millimolar. (B) Glucose consumption rates of MDA-mb-435 cells under normoxic and anoxic conditions as a function of incubation [glucose] in millimolar. For all plots, lines represent best fits to simple Michaelis-Menten equation. (C) Western blot of HIF-1α expression under normoxia and hypoxia.
Figure 5
Figure 5
Measurements of H+ diffusion. (A). Stirred bath apparatus, containing two gas-sealed well-stirred chambers separated by gelatin/agarose gel of thickness 0.2 cm and 2 cm2 surface area at 37°C. (B) Collapse of pH gradient across gel with time. Prior to experiment, the gel was equilibrated for 7 days with media in both chambers at a pH of 6.2. At t=0, the pH of the upper chamber was raised with a bolus addition of base (C). Calculated flux (J) of H+ equivalents moving from one side of the gel to the other, in both directions. (D) Collapse of [BH] gradient across the gel with time with three different buffers. (E) Collapse of free [H+] gradient across the gel with time with three different buffers. In this case, identical rates can be achieved only with increased flux, as β values are significantly different for all samples.
Figure 6
Figure 6
Titrations and model. (A) Representative titration curve for buffers used in stirred bath experiments showing constant b over range 6 to 9. (B) Titration curve of tumor interstitial fluids to determine buffering capacity, β. Curve represents average of five determinations, with 95% confidence belts indicated with dotted line. Straight line represents regression of filled data points to yield a β of 28 mM H+ equivalents (pH unit)-1. (C) Predicted spatially dependent interstitial pH values. These data were generated using a reaction-diffusion model of Griffiths et al. [33] using values generated in the current study: a diffusion coefficient D of 2x10⁻⁶ cm2 sec-1, a buffer concentration of 28mM [i.e., β of 28mM H+ (pH unit-1)], an interstitial buffer pKa of 6.7 (approximating linearity between 6.3 and 7.3), and proton production rates of 0.53 and 1.49 µmol min-1 cm-3 (see Materials and Methods section).

References

    1. Vaupel P, Kallinowski F, Okunieff P. Blood flow, oxygen and nutrient supply, and metabolic microenvironment of human tumors: a review. Cancer Res. 1989;49:6449–6465. [Review; 214 references] - PubMed
    1. Okunieff P, Dols S, Lee J, Singer S, Vaupel P, Neuringer LJ, Beshah K. Angiogenesis determines blood flow, metabolism, growth rate, and ATPase kinetics of tumors growing in an irradiated bed: 31P and 2H nuclear magnetic resonance studies. Cancer Res. 1991;51:3289–3295. - PubMed
    1. Wike-Hooley JL, Haveman J, Reinhold HS. The relevance of tumour pH to the treatment of malignant disease. Radiother Oncol. 1984;2:343–366. - PubMed
    1. Griffiths JR. Are cancer cells acidic? Br J Cancer. 1991;64:425–427. - PMC - PubMed
    1. Gillies RJ, Liu Z, Bhujwalla Z. 31P-MRS measurements of extracellular pH of tumors using 3-aminopropylphosphonate. Am J Physiol. 1994;267:t-203. - PubMed

Publication types

LinkOut - more resources