. 2003 Apr 1;22(7):1676-87.
doi: 10.1093/emboj/cdg151.

Human Tousled like kinases are targeted by an ATM- and Chk1-dependent DNA damage checkpoint

Affiliations

Human Tousled like kinases are targeted by an ATM- and Chk1-dependent DNA damage checkpoint

Anja Groth et al. EMBO J. .

Abstract

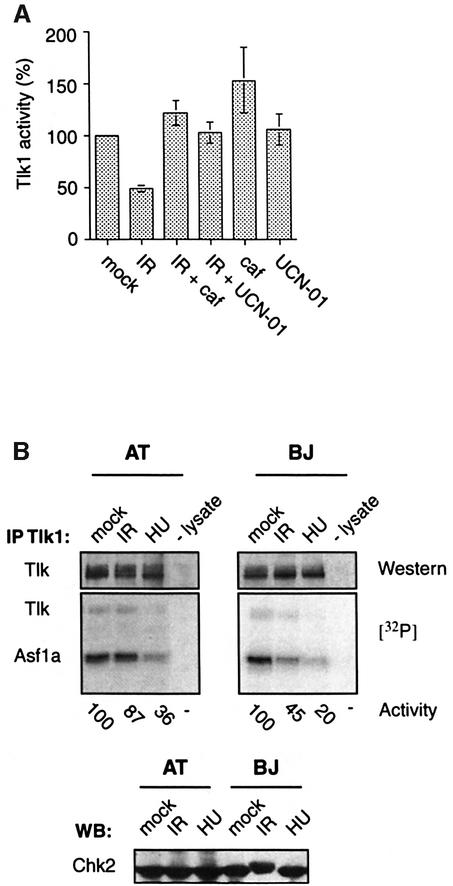
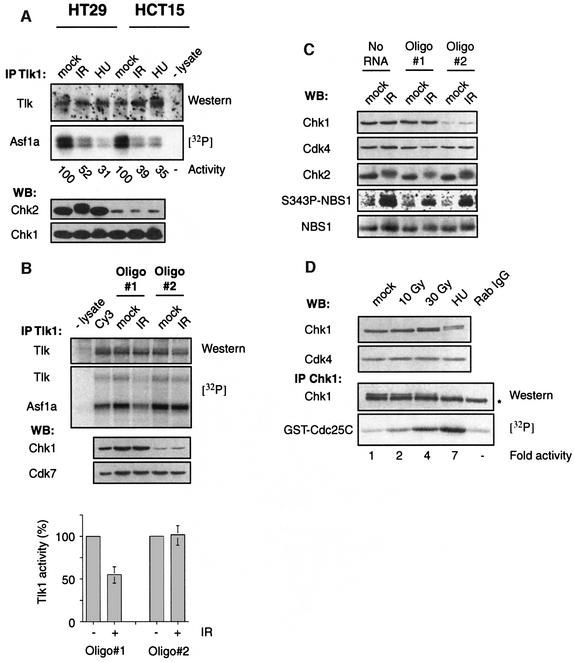
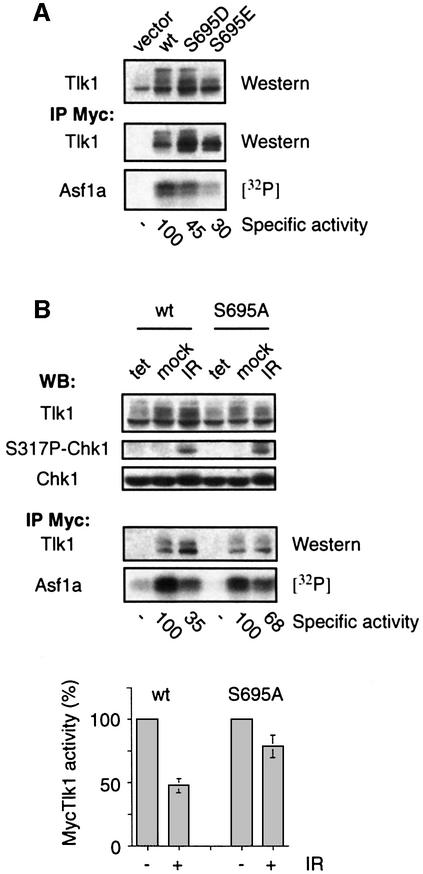
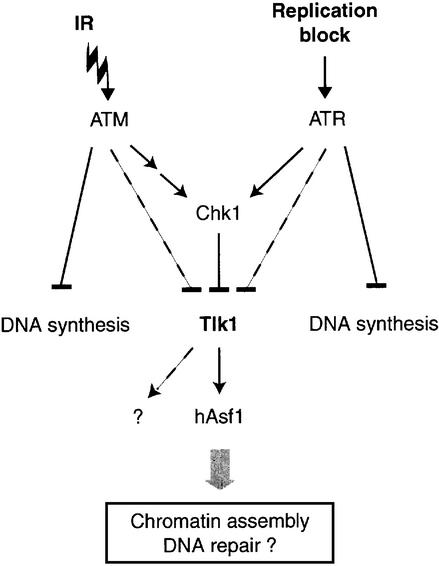
All eukaryotes respond to DNA damage by modulation of diverse cellular processes to preserve genomic integrity and ensure survival. Here we identify mammalian Tousled like kinases (Tlks) as a novel target of the DNA damage checkpoint. During S-phase progression, when Tlks are maximally active, generation of DNA double-strand breaks (DSBs) leads to rapid and transient inhibition of Tlk activity. Experiments with chemical inhibitors, genetic models and gene targeting through RNA interference demonstrate that this response to DSBs requires ATM and Chk1 function. Chk1 phosphorylates Tlk1 on serine 695 (S695) in vitro, and this UCN-01- and caffeine-sensitive site is phosphorylated in vivo in response to DNA damage. Substitution of S695 to alanine impaired efficient downregulation of Tlk1 after DNA damage. These findings identify an unprecedented functional co- operation between ATM and Chk1 in propagation of a checkpoint response during S phase and suggest that, through transient inhibition of Tlk kinases, the ATM-Chk1-Tlk pathway may regulate processes involved in chromatin assembly.


Figures

None
Fig. 1. Tlk1 is transiently inactivated in response to IR and UV irradiation, but continuously inhibited in the presence of HU. (A) Asynchronously growing U-2-OS cells were exposed to IR (10 Gy) and Tlk1 kinase activity was measured at the indicated times. The amount of Tlk protein in each kinase reaction was determined by immunoblotting (upper panel). The specific activity of Tlk1 was determined as the ratio of 32P incorporated into the substrate GST–Asf1a to the amount of Tlk protein in the individual reactions. The level and electrophoretic mobility of Tlk1 throughout the time course is shown by immunoblotting on whole-cell lysates run on a high-resolution SDS–PAGE gel (lower panel). Chk2 mobility and Chk1 phosphorylation on S317 were determined by immunoblotting (lower panel). (B) Asynchronously growing U-2-OS cells were exposed to UV and Tlk1 activity, and total protein levels were measured at the indicated times as in (A). (C) Asynchronously growing U-2-OS cells were treated with HU and analysed as in (B). (D) Asynchronously growing BJ fibroblasts were left untreated, exposed to IR (10 Gy) or treated with HU. Kinase activities were measured using either Tlk1- or Tlk2-specific antibodies or pan-Tlk antibody (TlkN). Chk2 activation was revealed by its mobility shift seen in SDS–PAGE on total cell lysates as a control for activation of the DNA damage response.
None
Fig. 2. S-phase-induced Tlk1 hyperactivation is inhibited by IR. (A) Tlk1 activity was measured in lysates of T98G cells arrested by serum deprivation (starved) or released from quiescence for 4 h (G1) or 18 h (S). The cells were left untreated (mock), exposed to IR (10 Gy) or treated with HU, and harvested 30 min later. The amount of Tlk in each kinase reaction was determined by immunoblotting (upper panel). FACS analysis of DNA content (lower panel) and immunoblotting for the S-phase marker cyclin A indicate cell cycle position. The blot of Cdk7 indicates equal loading. Immunoblotting with antibodies recognizing total Chk1, S317-phosphorylated Chk1 and total Chk2 were performed in parallel as indicated. (B) Tlk1 activity was measured in lysates of U-2-OS cells released into S phase from a dT block for 3 h (early), 6 h (middle) or 9.5 h (late), and treated as in (A). Progression through S phase was determined by flow cytometry and is shown next to cells in G1 for comparison. The amount of Tlk in each reaction and Chk1 phosphorylation at S317 were determined as in (A).
None
Fig. 3. Tlk1 activity is not directly dependent on ongoing DNA replication. (A) Graph showing relative Tlk1 activity and the rate of DNA synthesis in U-2-OS cells at the indicated times after IR (10 Gy). The relative Tlk1 activity was calculated as a mean value of two independent measurements and the deviation is illustrated by error bars. All DNA synthesis measurements were made in duplicate and similar results were obtained in three independent experiments. (B) Tlk1 activity and the rate of DNA synthesis were measured in U-2-OS cells left untreated or treated for 2 h with HU. Caffeine and UCN-01 were added 30 min prior to HU treatment as indicated. Tlk1 activity is given relative to the amount of Tlk in each reaction (specific activity) and DNA synthesis measurements were made in duplicate as in (A).
None
Fig. 4. Tlk1 inactivation in response to IR is ATM dependent and can be abrogated by caffeine and UCN-01. (A) Bar chart illustrating Tlk1 activity in untreated (mock) or IR-exposed U-2-OS cells pretreated with caffeine or UCN-01 for 30 min as indicated. Each bar represents at least three independent experiments. (B) AT fibroblasts (GM05849) and normal BJ fibroblasts were left untreated (mock), exposed to IR or treated with HU, and were analysed for Tlk1 activity. The amount of Tlk in each kinase reaction was revealed by immunoblotting (upper panel). The BJ fibroblasts had been released from contact inhibition to increase the fraction of cells in S phase, but similar results were obtained with asynchronously growing cells (Figure 1D). Compared with BJ fibroblasts, the response to HU in the AT cells was slightly less pronounced. Whether this reflects a minor role for ATM in HU- induced Tlk1 inhibition or simply cell type differences is unclear. The lack of ATM function in the AT fibroblasts was demonstrated by the absence of Chk2 electrophoretic mobility shift in response to IR (lower panel).
None
Fig. 5. IR-induced Tlk1 inactivation requires Chk1, but not Chk2. (A) Control HT29 and Chk2-deficient HCT15 cells were treated as in Figure 4B and analysed for Tlk1 activity. Equal input of Tlk1 in each kinase reaction was verified by immunoblotting (upper panel). The level and electrophoretic mobility of Chk2 and Chk1 were analysed by immunoblotting on total cell lysates (lower panel). (B) HeLa cells were transfected with two siRNA oligos specific for Chk1 or a Cy3-labelled oligo. Oligo 1 had no effect on Chk1 level and was used as a control for oligo 2 that silenced Chk1 expression. The Cy3 oligo served to estimate transfection efficiency by immunofluorescence. The efficient downregulation of Chk1 by oligo 2 was demonstrated by immunoblotting using Cdk7 as a loading control (middle panel). Forty-eight hours after transfection, the cells were either exposed to IR or left untreated (mock) and analysed for Tlk1 activity (upper panel). The input of Tlk1 in each kinase reaction was revealed by immunoblotting. The bar chart represents four independent experiments carried out as described above and normalized to untreated values. (C) The integrity of S-phase checkpoint responses was verified by immunoblotting, revealing an IR-induced Chk2 mobility shift and phosphorylation of NBS1 at S343 in cells transfected with oligo 1, oligo 2 or mock. (D) Dose-dependent activation of Chk1 in response to DSBs was measured in HeLa cells released into S phase for 2.5 h from a dT block. Cells were exposed to IR (10 or 30 Gy) or left untreated and harvested 35 min later. As a control for Chk1 activation, HeLa cells were treated for 18 h with HU (3 mM). The total level of Chk1 was determined by western blotting. The band representing cross-reacting rabbit IgG is indicated by an asterisk.
None
Fig. 6. Chk1 phosphorylates Tlk1 at S695. (A) U-2-OS cells incubated in the presence or absence of [32P]orthophosphate for 3 h were stained for γH2AX to reveal DSBs. (B) U-2-OS cells conditionally expressing MycTlk1 synchronized by a dT block were induced (– tet) or left repressed (+ tet) for 3 h before they were released into S phase in the presence or absence of [32P]orthophosphate for 3 h. Where indicated, caffeine and HU were added for the last 30 min. Cell lysates were assayed by immunoblotting using the indicated antibodies. (C) Cells were synchronized, induced and labelled with 32P as in (B), and treated with DMSO (mock), caffeine or UCN-01 for the last 30 min. Samples were immunoprecipitated using anti-Myc antibodies and processed for phosphopeptide mapping. (D) Phosphopeptide map of recombinant kinase-inactive (kd) MycTlk1 phosphorylated by Chk1 in vitro (left panel), and in vivo phosphopeptide maps of MycTlk1 S695A (middle panel) and MycTlk1 wt (right panel). U-2-OS-TA cells were transiently transfected with inducible vectors (pBI, tet off) before they were synchronized, induced and labelled with 32P as in (B). (E) The phosphopeptides indicated by arrows were eluted from the maps of MycTlk1 wt (C, left panel) and MycTlk1 kd (D, left panel), and similar amounts of phosphopeptide from in vivo and in vitro labelled MycTlk1 were applied for co-migration on TLC (right panel). The in vivo labelled phosphopeptide was used for phosphoamino acid analysis (middle panel) and sequenced by Edman degradation (left panel). The individual cycles were analysed for 32P-labelled amino acids, and the corresponding sequence of human Tlk1 with S695 highlighted in position 3 after the tryptic cleavage site is shown together with a Chk1 consensus site below.
None
Fig. 7. The phosphorylation status of S695 is critical for Tlk1 activity. (A) T98G cells were electroporated with constructs expressing Myc-tagged Tlk1 wt, S695D or S695E. Two days later, the cells were lysed and the activity of the MycTlk1 mutants against GST–Asf1a was measured. To calculate the specific activity of each mutant, the amounts of immunoprecipitated Tlk1 were determined by immunoblotting and quantified with a CCD camera. Similar results were obtained in five independent experiments. (B) U-2-OS cell clones inducible for MycTlk1 wt or S695A were induced briefly (2.75 and 2.25 h, respectively) to obtain a similar low expression level before the cells were exposed to IR (10 Gy) or left untreated. The cells were harvested 30 min later and the kinase activity of MycTlk1 was measured. The specific activity was determined from the amount of MycTlk1 in each reaction and is given relative to mock values (middle panel). Direct immunoblotting for Tlk1, phospho-S317 Chk1 and Chk1 confirmed similar low expression of MycTlk1 proteins and checkpoint activation, respectively. The bar chart represents seven independent experiments normalized to untreated values; the error bars show the SEM. Only experiments where the expression level of MycTlk1 S695A was similar to or less than MycTlk1 wt were included to ensure that the level of ectopic Tlk1 did not exceed the capacity of the checkpoint.
None
Fig. 8. Model for checkpoint regulation of Tlk1. ATM-dependent activation of Chk1 in response to DSBs leads to inhibition of Tlk1 activity through phosphorylation of Tlk1 at S695 by Chk1. This direct targeting of Tlk1 by Chk1 may work together with other ATM-dependent events to achieve efficient Tlk1 inhibition (see Discussion). A similar mode of regulation may occur in response to replication blocks and replicative stress, with ATR as the upstream kinase. The downregulation of Tlk activity would cause a delay of Tlk-dependent processes in S phase, such as the phosphorylation of hAsf1, which may be critical for efficient repair of DNA lesions.

References

    1. Abraham R.T. (2001) Cell cycle checkpoint signaling through the ATM and ATR kinases. Genes Dev., 15, 2177–2196. - PubMed
    1. Bassing C.H. et al. (2002) Increased ionizing radiation sensitivity and genomic instability in the absence of histone H2AX. Proc. Natl Acad. Sci. USA, 99, 8173–8178. - PMC - PubMed
    1. Bell D.W. et al. (1999) Heterozygous germ line hCHK2 mutations in Li–Fraumeni syndrome. Science, 286, 2528–2531. - PubMed
    1. Brown E.J. and Baltimore,D. (2000) ATR disruption leads to chromosomal fragmentation and early embryonic lethality. Genes Dev., 14, 397–402. - PMC - PubMed
    1. Celeste A. et al. (2002) Genomic instability in mice lacking histone H2AX. Science, 296, 922–927. - PMC - PubMed

Publication types