. 2003 Apr 1;22(7):1707-15.
doi: 10.1093/emboj/cdg143.

Structural organization of authentic, mature HIV-1 virions and cores

Affiliations

Structural organization of authentic, mature HIV-1 virions and cores

John A G Briggs et al. EMBO J. .

Abstract

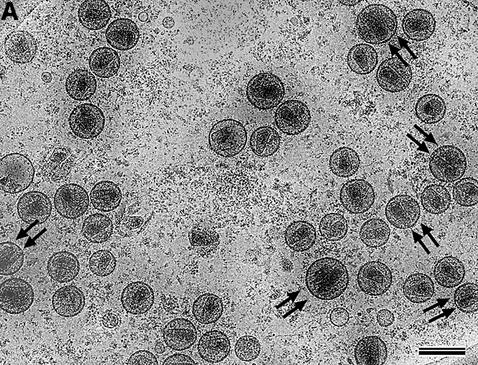
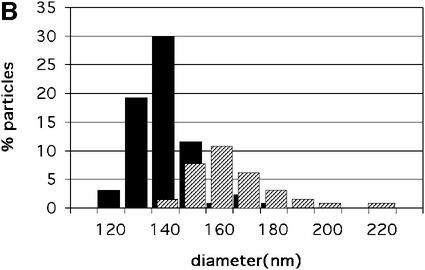
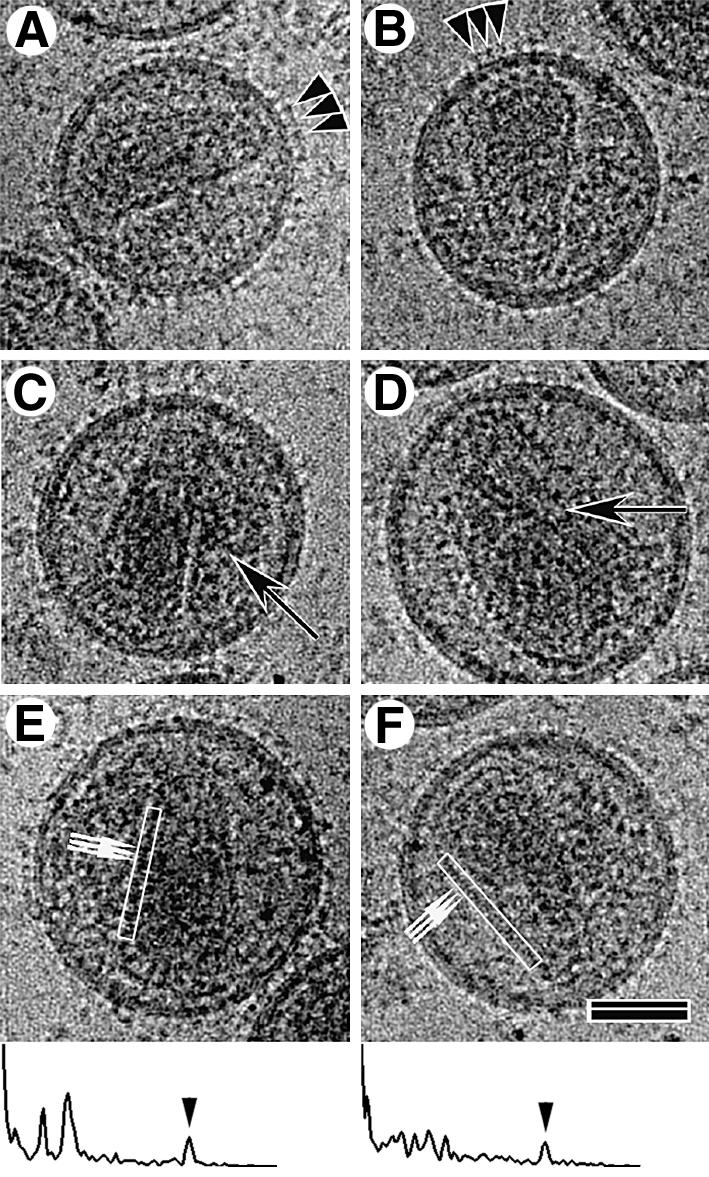
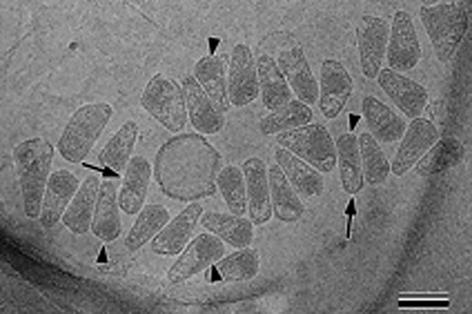
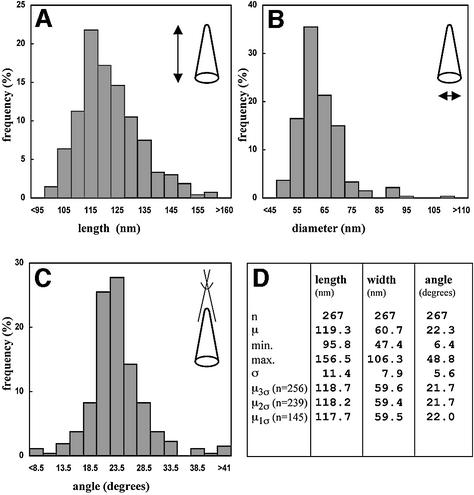
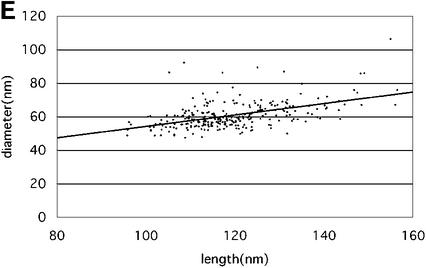
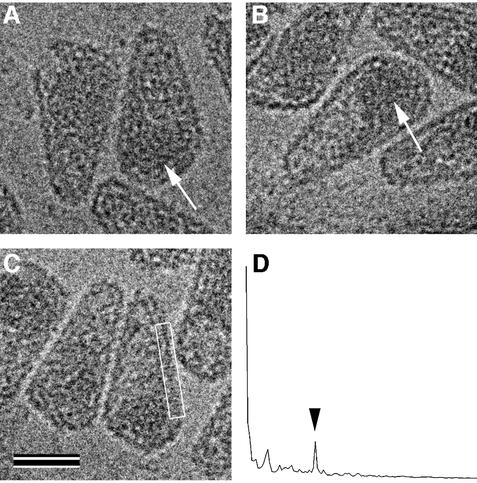
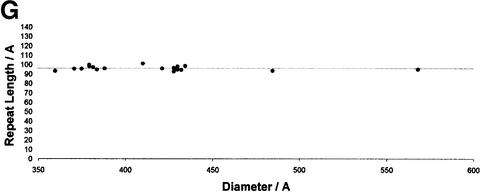
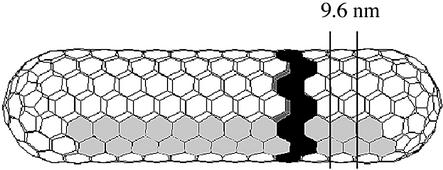
Mature, infectious HIV-1 particles contain a characteristic cone-shaped core that encases the viral RNA and replication proteins. The architectures of mature virions and isolated cores were studied using cryo-electron microscopy. The average size ( approximately 145 nm) of the virion was unchanged during maturation. Most virions contained a single core but roughly one-third contained two or more cores. Consideration of the capsid protein concentration during core assembly indicated that core formation in vivo is template-mediated rather than concentration-driven. Although most cores were conical, 7% were tubular. These displayed a stacked-disc arrangement with 7-, 8-, 9- or 10-fold axial symmetry. Layer line filtration of these images showed that the capsid subunit arrangement is consistent with a 9.6 nm hexamer resembling that previously seen in the helical tubes assembled from purified capsid protein. A common reflection (1/3.2 nm) shared between the tubular and conical cores suggested they share a similar organization. The extraordinary flexibility observed in the assembly of the mature core appears to be well suited to accommodating variation and hence there may be no single structure for the infectious virion.


Figures

None
Fig. 1. (A) cEM of mature HIV-1. Mature HIV-1 particles were harvested from infected MT-4 cells before a cytopathic effect was established. Virions were inactivated with paraformaldehyde before vitrification. Released virus particles displayed a broad range of diameters, extending from 120 to 200 nm (mean 145 ± 25 nm, n = 255). The majority of virions contained a single core, but a significant number of particles (32.6%) contained two or more cores. Virions with a single core were clearly smaller in diameter than virions with two cores (marked with double arrows). Scale bar represents 150 nm. (B) The distribution of sizes of HIV-1 virions bearing one and two cores. The distribution of radii is displayed for 132 virions. Particles that appeared to contain more than two cores were excluded. The mean size of the virions containing a single core (134 ± 11 nm, n = 89, black bars) was significantly smaller (for equal means, t = 9.3, Prob. = 1.2 × 10–15) than the mean size of virions containing two cores (158 ± 16 nm, n = 43, hashed bars).
None
Fig. 2. cEM analysis of the mature virion. Most mature virions displayed regular membrane projections (A and B, arrowheads) and contained cone-shaped cores. Many particles contained a complete second core, which can be conical, tubular (C and D, arrows) or amorphous. cEM allowed the visualization of the regular arrangement of core subunits (small arrows in E and F), which were spaced at 3.2 ± 0.48 nm, n = 60. The power spectra of the boxed regions demonstrating the presence of the 3.2 nm repeat (arrowheads) along one side of the cone are shown below panels (E) and (F). The broad end of the conical core was usually located in proximity to the membrane; however, no connection could be observed. The scale bar represents 50 nm.
None
Fig. 3. Overview of isolated HIV-1 cores in cEM. Intact cores were prepared by brief detergent treatment and centrifugation in a microcentrifuge as described (Welker et al., 2000). This figure shows a representative cEM image depicting isolated cores of heterogeneous size and shape. The majority of the isolated cores displayed a conical shape while a minor fraction was found to be tubular (∼7%, arrows). In most cases, the regular arrangement of the wall subunits was preserved. Many cores showed an increased density at the broad end, presumably due to the condensed viral RNP in this position (arrowheads). The scale bar represents 100 nm.
None
Fig. 4. Size and geometric variation of HIV-1 cores. The histograms show the distribution of length (A), diameter (B) and angle at the narrow end (C) of conical HIV-1 cores. Length and diameter were measured once for each core, while the mean of three independent measurements was used in case of the angle. Particles were excluded if the standard deviation of three measurements for the cone angle was >15% of the respective mean, or if all three parameters could not be measured. Arbitrary size classes were defined for each parameter, and the frequency of cores found for each class was plotted. (D) A tabulated version of the results. Abbreviations: n, number; µ, mean; min., minimal value; max., maximal value; σ, standard deviation; µ, µ or µ, mean calculated from the fraction of particles within the range of three (n = 256), two (n = 239) or one (n = 145) standard deviation of the overall mean, respectively. The correlation between the width at the broad end of the core and the overall length is shown in (E). The slope of the line corresponded to an included angle of 19.7 ± 2°.
None
Fig. 5. Isolated HIV-1 cores retain well-ordered subunits and terminal structures on both ends. (AC) Typical cores appeared closed at both ends. The white arrows mark the positions of density that we presume to correspond to the RNP in the cores. The scale bar represents 50 nm. The power spectrum of the region boxed in (C) is shown in (D). The detergent treatment had little effect on the regular arrangement of CA subunits, as indicated by the preservation of the ∼3.2 nm reflection (arrowhead).
None
Fig. 6. Image processing of a tubular core. The steps of image processing are shown for a tubular core. (A) The raw image of the isolated core. The power spectrum of this core is shown in (B), with the corresponding collapsed intensity profile in (C). The orders of the 1/9.6 nm reflections were labeled. Suppression of the off-layer line noise in (B) gives the filtered power spectrum in (E). The corresponding layer line filtered image is shown in (D). (F) The image in (D) after application of 2-fold symmetry. (G) The repeat length of the tubular cores is independent of their diameter. The scale bar in (F) represents 10.0 nm.
None
Fig. 7. Schematic of a stacked-disc fullerene tube. The figure illustrates one possible structure of a stacked-disc fullerene tube. One disc in the stack is shaded black. Removing or adding a strip of hexamers such as that shaded in gray varies the width of the tube body. The tube shown is formed from eight such strips. The tube ends illustrated represent one of a number of possible constructions. The 9.6 nm repeat is marked.

References

    1. Accola M.A., Ohagen,A. and Gottlinger,H.G. (2000) Isolation of human immunodeficiency virus type 1 cores: retention of Vpr in the absence of p6(gag). J. Virol., 74, 6198–6202. - PMC - PubMed
    1. Adachi A., Gendelman,H.E., Koenig,S., Folks,T., Willey,R., Rabson,A. and Martin,M.A. (1986) Production of acquired immunodeficiency syndrome-associated retrovirus in human and nonhuman cells transfected with an infectious molecular clone. J. Virol., 59, 284–291. - PMC - PubMed
    1. Ashorn B., McQuade,J.M., Thaisvivongs,S., Tomasselli,A.G., Tarpley, W.G. and Moss,B. (1990) An inhibitor of the protease blocks maturation of human and simian immunodeficiency virus and the spread of infection. Proc. Natl Acad. Sci. USA, 87, 7472–7476. - PMC - PubMed
    1. Barklis E. et al. (1996) Structural analysis of membrane bound retrovirus capsid proteins. EMBO J., 16, 1199–1213. - PMC - PubMed
    1. Barklis E., McDermott,J., Wilkens,S., Fuller,S. and Thompson,D. (1998) Organization of HIV-1 capsid proteins on a lipid monolayer. J. Biol. Chem., 273, 7177–7180. - PubMed

Publication types