. 2003 Jun 13;278(24):21655-21662.
doi: 10.1074/jbc.M302536200. Epub 2003 Mar 27.

Organization of the G protein-coupled receptors rhodopsin and opsin in native membranes

Affiliations

Organization of the G protein-coupled receptors rhodopsin and opsin in native membranes

Yan Liang et al. J Biol Chem. .

Abstract

G protein-coupled receptors (GPCRs), which constitute the largest and structurally best conserved family of signaling molecules, are involved in virtually all physiological processes. Crystal structures are available only for the detergent-solubilized light receptor rhodopsin. In addition, this receptor is the only GPCR for which the presumed higher order oligomeric state in native membranes has been demonstrated (Fotiadis, D., Liang, Y., Filipek, S., Saperstein, D. A., Engel, A., and Palczewski, K. (2003) Nature 421, 127-128). Here, we have determined by atomic force microscopy the organization of rhodopsin in native membranes obtained from wild-type mouse photoreceptors and opsin isolated from photoreceptors of Rpe65-/- mutant mice, which do not produce the chromophore 11-cis-retinal. The higher order organization of rhodopsin was present irrespective of the support on which the membranes were adsorbed for imaging. Rhodopsin and opsin form structural dimers that are organized in paracrystalline arrays. The intradimeric contact is likely to involve helices IV and V, whereas contacts mainly between helices I and II and the cytoplasmic loop connecting helices V and VI facilitate the formation of rhodopsin dimer rows. Contacts between rows are on the extracellular side and involve helix I. This is the first semi-empirical model of a higher order structure of a GPCR in native membranes, and it has profound implications for the understanding of how this receptor interacts with partner proteins.


Figures
F<sc>ig</sc>. 1
Fig. 1
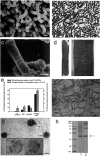
Isolation and characterization of mouse ROS. a, scanning electron micrograph of mouse ROS attached to the retina. b, light micrograph of isolated ROS indicating the purity of the preparation. c, scanning electron micrograph of isolated ROS. d, transmission electron micrographs of lower and higher magnifications of isolated sectioned ROS. Disks are arranged in a stack and are surrounded by the plasma membrane (panel 1). An incisure running through the ROS can be discerned at a higher magnification (panel 2). Each disk has cytoplasmic and extracellular (intradiscal) surfaces and a rim region that joins the two layers of the bilayer. e, permeability of ROS as tested using phosphorylation of rhodopsin and redox reactions. The gray bars show the assays of rhodopsin phosphorylation of intact ROS under different conditions. The black bars represent the dehydrogenase assays using [C4-3H]NADPH under different conditions. f, electron micrograph of isolated disks prepared by thin sectioning. Isolated disks appeared as vesicles. g, electron microscopy of immunogold-labeled and negatively stained isolated disks. The arrows indicate native disks exposing the cytoplasmic surface, which is labeled with the 1D4 antibody specific toward the C terminus of rhodopsin. Inset 1, membrane from burst disk exposing the extracellular surface and incubated with antibody 1D4. Gold particles are observed at the periphery of the disk. Inset 2, same as inset 1 but incubated with antibody 4D2 against the N terminus of rhodopsin. Gold particles are evenly distributed on the extracellular surface of the disk. h, Coomassie Blue-stained SDS-polyacrylamide gel of isolated ROS (lane 1) and isolated disks (lane 2). Rhodopsin is found predominantly as a monomer (arrow) but also as a multimer (lane 2). Scale bars: 1 μm (a), 6 μm (b), 1 μm (c), 0.5 μm (d, 1), 0.3 μm (d, 2), 0.6 μm (f and g), and 0.3 μm (insets in g).
F<sc>ig</sc>. 2
Fig. 2
Morphology of intact native disks adsorbed to mica and imaged in buffer solution. Shown are height (a) and deflection (b) images of an intact disk membrane having a typical thickness of 16–17 nm. Three different surface types are evident: the cytoplasmic surface of the disk (type 1), co-isolated lipid (type 2), and mica (type 3). The deflection image (b) reveals that surface type 1 is rough compared with bare lipid (type 2), indicating the presence of densely packed proteins. The arrowheads mark defects introduced by the AFM tip during scanning. Scale bars: 250 nm (a and b). Vertical brightness ranges: 60 nm (a) and 0.6 nm (b).
F<sc>ig</sc>. 3
Fig. 3
Topography of an open, spread-flattened disk adsorbed to mica and imaged in buffer solution. a, height image of the open, spread-flattened disk. Four different surface types are evident: the cytoplasmic surface of the disk (types 1 and 4), lipid (type 2), and mica (type 3). The topographies of regions 1 (b) and 4 (c) at higher magnification reveal densely packed rows of rhodopsin dimers. Besides paracrystals, single rhodopsin dimers (broken ellipses) and occasional rhodopsin monomers (arrowhead) are discerned floating in the lipid bilayer. Scale bars: 250 nm (a) and 15 nm (b and c). Vertical brightness ranges: 22 nm (a) and 2.0 nm (b and c).
F<sc>ig</sc>. 4
Fig. 4
Organization of opsin in native Rpe65−/− disk membranes. a, three different surface types are discerned in the deflection image of a single-layered Rpe65−/− disk membrane: the paracrystalline, cytoplasmic surface of opsin (type 1), lipid (type 2), and mica (type 3). a, inset, calculated power spectrum of the paracrystalline region displayed in a. The first-order diffraction spot at (3.8 nm)−1 is marked by an arrow. b, the paracrystalline arrangement of opsin dimers (broken ellipse) in the native membrane. Occasional single opsin monomers are marked by arrowheads. c, the corrugated and flexible extracellular surface of opsin. The height between the lipid bilayer surface (asterisk) and clusters of opsin (triangle) is 2.8 ± 0.2 nm (n = 60). Scale bars: 50 nm (a), 5 nm−1 (a, inset), 15 nm (b), and 50 nm (c). Vertical brightness ranges: 0.3 nm (a), 1.6 nm (b), and 3.3 nm (c).
F<sc>ig</sc>. 5
Fig. 5
Electron microscopy of negatively stained native disk membranes adsorbed on carbon film. Power spectra were calculated from a circular region adsorbed directly to the carbon film (left inset) and from another one lying on a disk membrane (right inset). Both diffraction patterns document crystallinity irrespective of the support. Scale bars: 150 and 2.5 nm−1 (left and right insets, respectively).
F<sc>ig</sc>. 6
Fig. 6
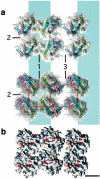
Model for the packing arrangement of rhodopsin molecules within the paracrystalline arrays in native disk membranes. a, rhodopsin assembles into dimers through a contact provided by helices IV and V (contact 1). Dimers form rows (highlighted by a blue band) as a result of contacts between the cytoplasmic loop connecting helices V and VI and helices I and II from the adjacent dimer (contact 2). Rows assemble into paracrystals through extracellular contacts formed by helix I (contact 3). Only half of the second row is shown. Views: extracellular (top panel) and cytoplasmic (bottom panel) sides of rhodopsin. Helices of rhodopsin are colored as shown: helix I in blue, helix II in light blue, helix III in green, helix IV in light green, helix V in yellow, helix VI in orange, and helix VII and cytoplasmic helix 8 in red. b, surface of rhodopsin molecules showing the locations of charged Glu and Asp (red) and Arg and Lys (blue) residues. A single line of negative charges is located close to the long groove on the cytoplasmic surface of the rhodopsin dimer. Scale bar = 2.5 nm.
F<sc>ig</sc>. 7
Fig. 7
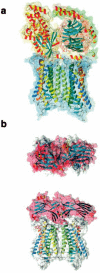
Model of the Gt- and arrestin-rhodopsin dimer complexes. a, theoretical model of the Gt-rhodopsin dimer complex. Helices of rhodopsin are colored as in Fig. 6. Gt is represented in a yellow space-filled background for the α-subunit, in red for the β-subunit, and in green for the γ-subunit. No optimization of the structure was carried out. b, the theoretical model reflects the interaction of one arrestin molecule with the rhodopsin dimer. The rhodopsin dimer is shown as in a, and the complex is shown from a top and side view. The secondary structures of Gt and arrestin are shown in the default colors of MolMol (26), with helices in yellow-red and β-strands in cyan.

Similar articles

Cited by

References

    1. Gehring WJ. Int. J. Dev. Biol. 2002;46:65–73. - PubMed
    1. Stryer L. Biopolymers. 1985;24:29–47. - PubMed
    1. Ballesteros J, Palczewski K. Curr. Opin. Drug Discov. Dev. 2001;4:561–574. - PMC - PubMed
    1. Pierce KL, Premont RT, Lefkowitz RJ. Nat. Rev. Mol. Cell. Biol. 2002;3:639–650. - PubMed
    1. Palczewski K, Kumasaka T, Hori T, Behnke CA, Motoshima H, Fox BA, Le Trong I, Teller DC, Okada T, Stenkamp RE, Yamamoto M, Miyano M. Science. 2000;289:739–745. - PubMed

Publication types

MeSH terms

Associated data

LinkOut - more resources