

Kinetics of CD4+ and CD8+ memory T-cell responses during hepatitis C virus rechallenge of previously recovered chimpanzees
- PMID: 12663785
- PMCID: PMC152131
- DOI: 10.1128/jvi.77.8.4781-4793.2003
Kinetics of CD4+ and CD8+ memory T-cell responses during hepatitis C virus rechallenge of previously recovered chimpanzees
Abstract
The immunological correlates of hepatitis C virus (HCV)-specific immunity are not well understood. Antibodies to HCV structural proteins do not appear to play a key role in clearance of the virus and do not persist after recovery. Here, we studied the kinetics of the cellular immune responses of three HCV-recovered chimpanzees during rechallenge with increasing doses of homologous HCV. Although HCV envelope antibodies remained undetectable throughout the rechallenge, all animals mounted rapid HCV-specific T-cell responses. The pattern of the cellular immune response in blood and liver correlated with the virological outcome. The animal that most rapidly cleared circulating HCV as determined by nested reverse transcription-PCR (RT-PCR) displayed the most vigorous and sustained response of gamma interferon (IFN-gamma)-producing and proliferating CD4(+) T cells in the blood. Vigorous CD4(+) T-cell proliferation during viremia was followed by an increased frequency and a phenotypic and functional change of the tetramer(+) CD8(+) T-cell population. The second animal cleared HCV initially with strong peripheral and intrahepatic CD4(+) T-cell responses but experienced low-level HCV recrudescence 12 weeks later, when HCV-specific T cells became undetectable. The third animal maintained minute amounts of circulating HCV, detectable only by nested RT-PCR, in the face of a weak IFN-gamma(+) T-cell response. Collectively, the results suggest protective rather than sterilizing immunity after recovery from hepatitis C. The rate of HCV clearance following reexposure depends on the cellular immune response, the quality and quantity of which may vary among chimpanzees that recovered from HCV infection.
Figures
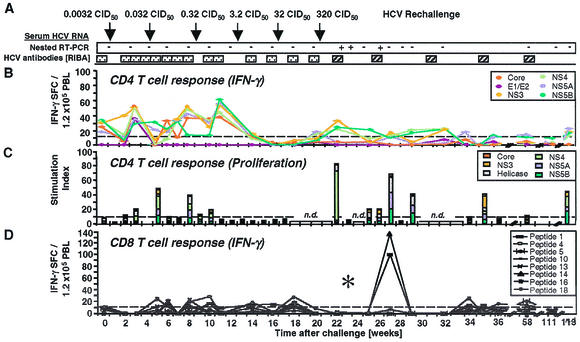
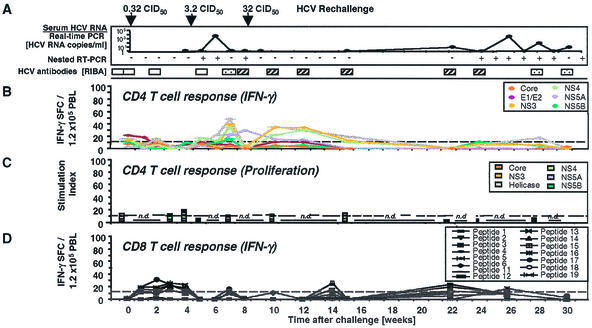
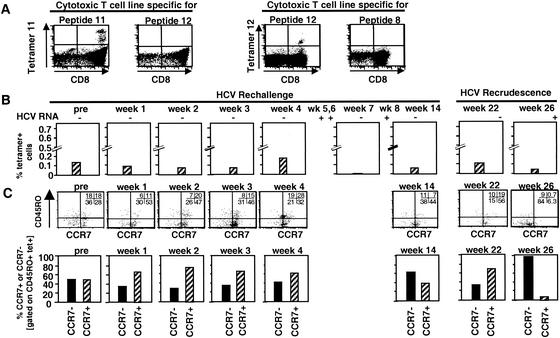
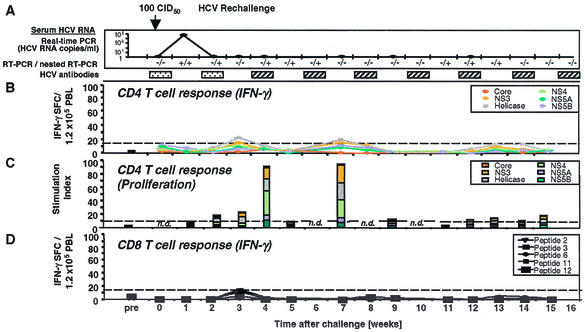
 ), a single HCV band with an intensity equal to or greater than that of the IgG control band was detected; positive (▨), at least two HCV bands with intensities equal to or greater than that of the IgG control band were detected. Only antibodies against HCV NS3 and NS4B were detected; all other antigens, including the E1/E2 glycoproteins, tested negative. (B) Frequency of HCV-specific T cells that produce IFN-γ in response to HCV proteins (ELISPOT analysis). Responses are indicated as specific spot-forming cells (SFC) per 1.2 × 10⁵ peripheral blood lymphocytes (PBL) (number of SFC in the presence of antigen − number of SFC in the absence of antigen). (C) Proliferative T-cell response to HCV proteins. The stimulation index represents proliferation in the presence of antigen divided by proliferation in the absence of antigen. Dotted line, cutoff of positivity; n.d., not done. (D) Frequency of HCV-specific CD8+ T cells that produce IFN-γ in response to eight HCV peptide epitopes (ELISPOT analysis). HCV peptides were selected according to the animal's Patr haplotype (38). ∗, time point (week 23) with the highest number of tetramer+ T cells (see Fig. 2C).
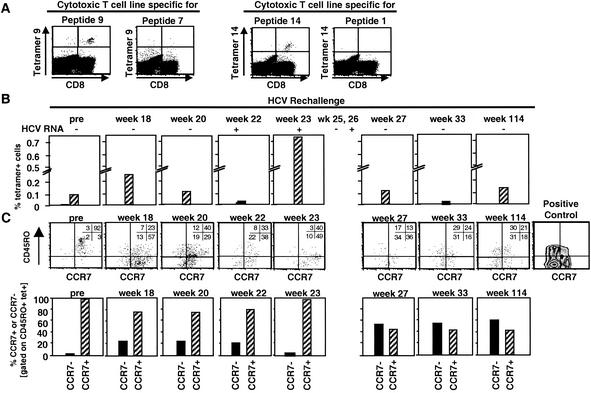
References
-
- Altman, J., P. A. H. Moss, P. Goulder, D. Barouch, M. McHeyzer-Williams, J. I. Bell, A. J. McMichael, and M. M. Davis. 1996. Phenotype analysis of antigen specific T lymphocytes. Science 274:94-96. - PubMed
-
- Bassett, S. E., B. Guerra, K. Brasky, E. Miskovsky, M. Houghton, G. R. Klimpel, and R. E. Lanford. 2001. Protective immune response to hepatitis C virus in chimpanzees rechallenged following clearance of primary infection. Hepatology 33:1479-1487. - PubMed
-
- Botarelli, P., M. R. Brunetto, M. A. Minutello, P. Calvo, D. Unutmaz, A. J. Weiner, Q.-L. Choo, J. R. Shuster, G. Kuo, F. Bonino, M. Houghton, and S. Abrignani. 1993. T-lymphocyte response to hepatitis C virus in different clinical courses of infection. Gastroenterology 104:580-587. - PubMed
-
- Carmichael, A., X. Jin, P. Sissons, and L. Borysiewicz. 1993. Quantitative analysis of the human immunodeficiency virus type 1 (HIV-1)-specific cytotoxic T lymphocyte (CTL) response at different stages of HIV-1 infection: differential CTL responses to HIV-1 and Epstein-Barr virus in late disease. J. Exp. Med. 177:249-256. - PMC - PubMed
Publication types
MeSH terms
Substances
Grants and funding
LinkOut - more resources
Full Text Sources
Other Literature Sources
Medical
Research Materials
