. 2003 Jun 1;549(Pt 2):453-69.
doi: 10.1113/jphysiol.2003.040428. Epub 2003 Mar 28.

Chloride currents in acutely isolated Xenopus retinal pigment epithelial cells

Affiliations

Chloride currents in acutely isolated Xenopus retinal pigment epithelial cells

H Criss Hartzell et al. J Physiol. .

Abstract

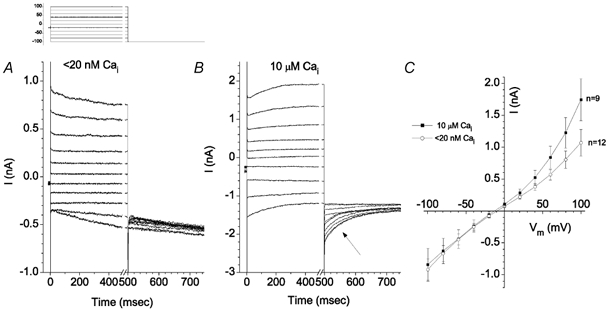
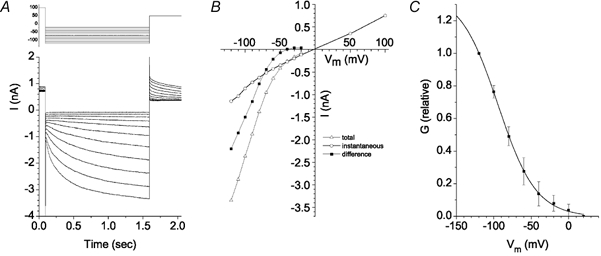
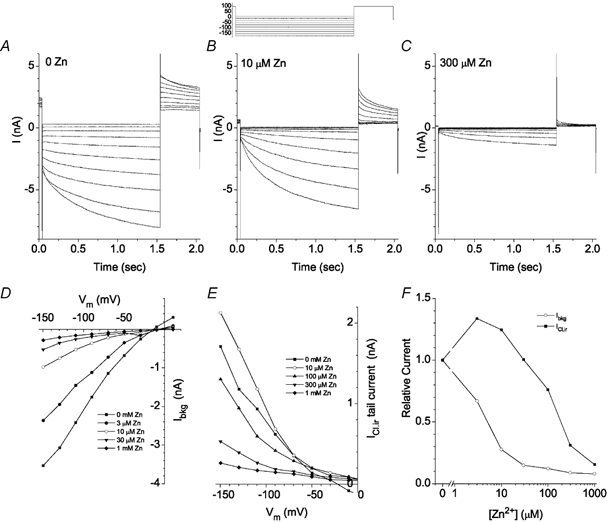
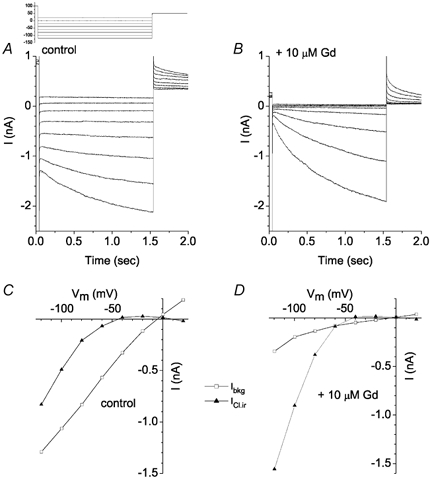
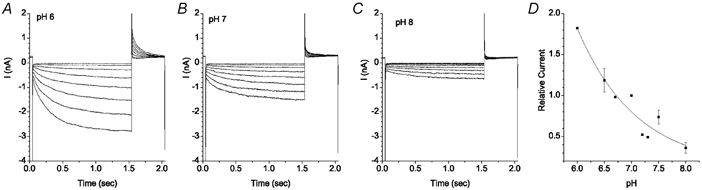
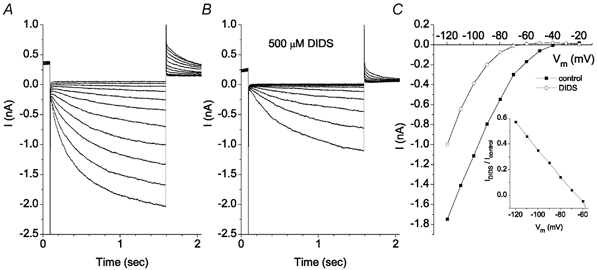
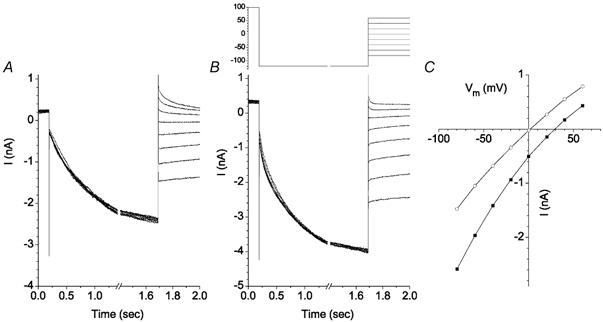
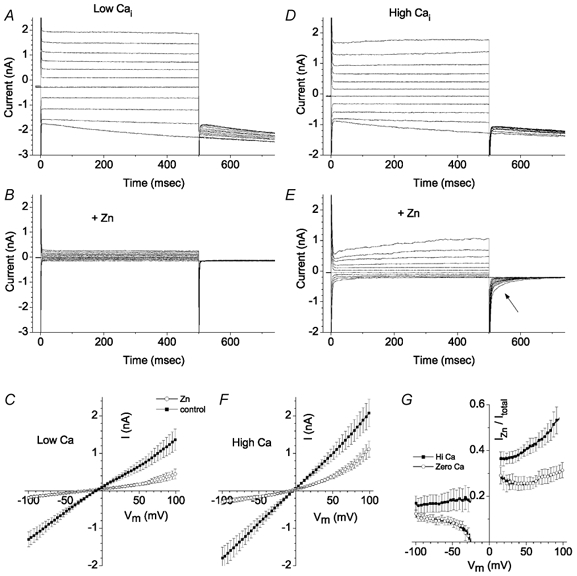
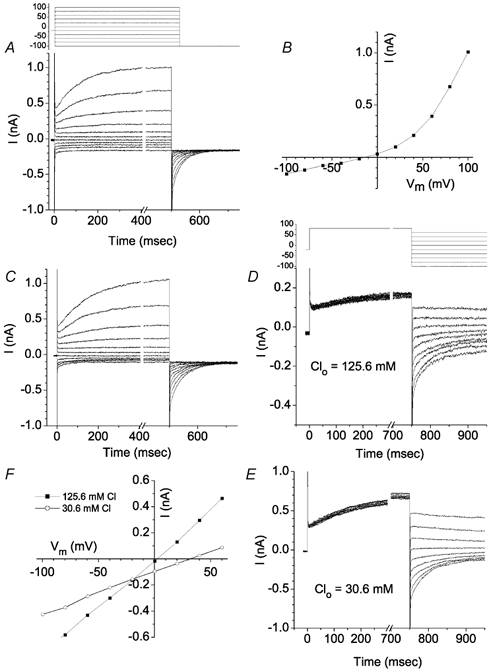
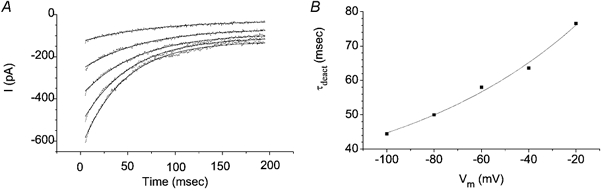
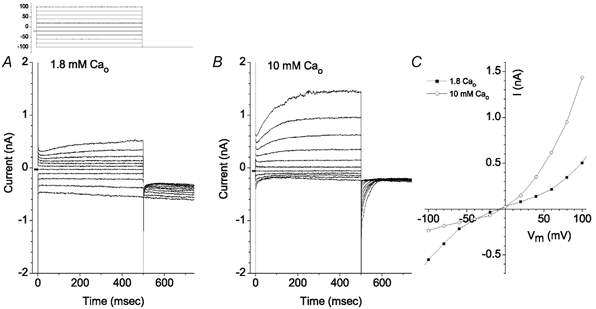
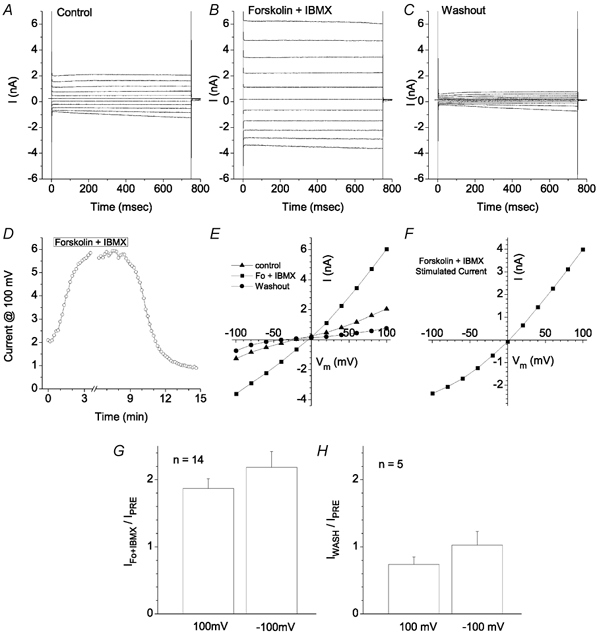
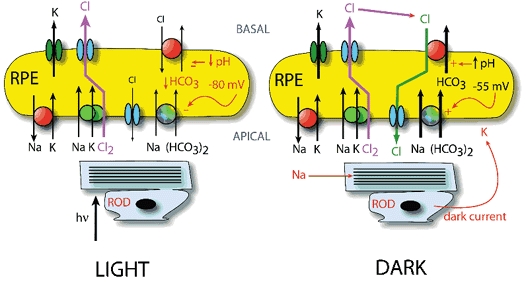
The retinal pigment epithelium (RPE) regulates the ionic composition of the fluid surrounding the photoreceptors by transport mechanisms that utilize Cl- channels. Cl- currents in RPE cells, however, remain incompletely characterized. The purpose of this study was to identify the Cl- currents in acutely isolated Xenopus RPE cells using whole-cell patch clamp. We describe three different Cl- currents. (1) An inwardly rectifying Cl- current, ICl,ir, activates slowly with hyperpolarization (tauact = ~1 s at -80 mV, V1/2= -94 +/- 3 mV), is blocked by Zn2+ (IC50 =185 microM), is stimulated by acid (ICl,ir is 5 times larger at pH 6 than pH 8), and is blocked by DIDS in a voltage-dependent manner. ICl,ir closely resembles cloned ClC-2currents. (2) An outwardly rectifying Cl- current, ICl,Ca, is stimulated by elevated cytosolic free [Ca2+]. With 1 microM free [Ca2+]i in the patch pipette, ICl,Ca activates slowly with depolarization (tauact =325 ms at 100 mV) and deactivates upon hyperpolarization. ICl,Ca is not blocked by 1 mM Zn2+ or 10 microM Gd3+ but is blocked by DIDS. High extracellular [Ca2+] (10 mM) also activates ICl,Ca. (3) A non-rectifying current is activated by elevation of cytoplasmic cAMP with forskolin and IBMX. In addition to these three Cl- currents, Xenopus RPE cells exhibit a non-selective background current (Ibkg) which has a linear I-V relationship and is voltage insensitive. This current is blocked by Zn2+ (IC50 of 5.3 microM) or 10 microM Gd3+. This description provides new insights into the physiology of Cl- channels involved in salt and fluid transport by the retinal pigment epithelium.


Figures

Figure 1
Figure 1. Micrographs of isolated Xenopus RPE cells
Xenopus RPE cells were isolated enzymatically as described in Methods. Calibration bar, 10 μm. A, a typical cell within 12 h of isolation. B, usual appearance of cells 24 h later. C, cells 24 h after isolation with melanin granules in the microvilli.
Figure 2
Figure 2. Cl currents in isolated Xenopus RPE cells
Standard extracellular and intracellular solutions are described in Methods. Cells were voltage clamped in whole-cell mode. Holding potential was −20 mV. Upper left: voltage clamp protocol. A, traces recorded from a cell with the pipette solution containing < 20 nm free Ca2+. B, traces recorded from a cell with the pipette solution containing 10 μm free Ca2+. C, average steady-state current-voltage relationships for cells with < 20 nm Ca2+ (○, n = 12) or 10 μm free Ca2+ (▪, n = 9).
Figure 3
Figure 3. Ca2+-independent currents in Xenopus RPE cells
Holding potential was −20 mV. Cells were depolarized to +100 mV for 500 ms prior to hyperpolarizing to various potentials as shown in the voltage clamp protocol in A. A, current traces showing an instantaneous time-independent inward current followed by a slow time-dependent activation of an inward current upon hyperpolarization. Deactivating tail currents are observed upon depolarization to +50 mV. B, current-voltage relationships. ○, instantaneous current at onset of voltage pulse. This current was defined as Ibkg. ▵, total current at the end of the 1.5 s hyperpolarizing pulse. ▪, the time-dependent current obtained by subtracting the instantaneous current from the total current. This time-dependent current was defined as ICl,ir. C, activation curve for ICl,ir. The conductance (G) for ICl,ir was determined by measuring the instantaneous amplitude of the tail currents upon repolarizing to +50 mV as in A and dividing by the driving force (50 mV). G for each tail current was plotted vs. the voltage of the preceding hyperpolarizing pulse. (n = 5; ±s.e.m.).
Figure 4
Figure 4. Ibkg and ICl,ir have different sensitivities to Zn2+ blockade
The voltage protocol is shown above B; this experiment is typical of 5 cells. A-C, current traces recorded from an isolated Xenopus RPE cell in Ringer solution (A) and in Ringer solution containing 10 μm (B) or 300 μm (C) Zn2+. D, current-voltage relationship of the instantaneous current at the onset of the hyperpolarizing pulse (Ibkg) in 0 (▪), 3 μm (•), 10 μm (○), 30 μm (▾) and 1 mm (♦) Zn2+. E, current-voltage relationship for ICl,ir tail currents recorded at +100 mV in 0 (▪), 10 μm (○), 100 μm (▴), 300 μm (▾), and 1 mm (♦) Zn2+. Virtually identical results were obtained if the time-dependent inward current rather than tail current amplitude was used as a measure of ICl,ir. F, inhibition of Ibkg and ICl,ir by Zn2+. Ibkg and ICl,ir in different [Zn2+] were normalized to the control current in the absence of Zn2+.
Figure 5
Figure 5. Effect of Gd3+ on Ibkg
The voltage clamp protocol is shown in the inset. Current traces in the absence (A) and presence of 10 μm Gd3+ (B) are shown. C, control current-voltage relationships of the instantaneous current, Ibkg (□), and time-dependent current, ICl,ir (▴), in the absence of Gd3+. D, current-voltage relationships of the currents in the presence of 10 μm Gd3+. This experiment is typical of 5 cells.
Figure 6
Figure 6. pH dependence of ICl,ir
Voltage protocol as in Fig. 5. Solutions contained 10 μm Gd3+. A-C, current traces in solution of pH 6 (A), pH 7 (B) and pH 8 (C). D, mean relative amplitude of ICl,ir at different pH. Currents measured at −130 mV were normalized to the current at pH 7. This experiment is typical of 3 cells.
Figure 7
Figure 7. ICl,ir is blocked by DIDS in a voltage-dependent manner
Voltage protocol as in Fig. 3. Solutions contained 10 μm Gd3+. A, control traces. B, traces recorded in the presence of 0.5 mm DIDS. C, current-voltage curves in the control solution (▪) and in 0.5 mm DIDS (○). Inset: the fraction of current not blocked by DIDS is plotted vs. membrane potential. This experiment is typical of 3 cells.
Figure 8
Figure 8. Cl sensitivity of ICl,ir
The voltage clamp protocol is shown above B. The solutions contained 10 μm Gd3+. A, current traces recorded with 125.6 mm Cl in the bath solution. B, current traces recorded with 30.6 mm Cl in the bath solution. C, instantaneous current-voltage relationships measured at the onset of the voltage step after the −120 mV hyperpolarizing pulse. ▪, 125.6 mm Cl. ○, 30.6 mm Cl. Typical of 3 experiments.
Figure 9
Figure 9. Effect of Zn2+ on currents in cells recorded with high and low cytoplasmic [Ca2+]
A-C, < 20 nm[Ca2+]i. D-F, 10 μm[Ca2+]i. Currents were recorded in control Ringer solution (A and D) and then 1 mm ZnCl2 was added (B and E). In E note the deactivating tail current (arrow). C and F, average (n = 8) current-voltage relationships for cells with < 20 nm[Ca2+]i (n = 7) (C) and 10 μm[Ca2+]i (F). Current-voltage relationships were determined from a voltage ramp protocol consisting of a 225 ms pulse to −100 mV followed by a 1 s ramp to 100 mV. G, fraction of Zn2+-insensitive current. The ratio of currents in the absence and presence of 1 mm Zn2+ (from C and F) was calculated at each potential. between −20 and +20 mV the values are blanked because the signal-to-noise ratio of the currents was too large to calculate a reliable ratio.
Figure 10
Figure 10. Ca2+-activated Cl current in Xenopus RPE cells
Voltage protocol for A and C is shown above A. Voltage protocol for D and E is shown above D. A, Ca2+-activated Cl current in a cell bathed in Cs-Ringer solution containing 1 mm Zn2+. B, steady-state current-voltage relationship for the traces in A. Currents were measured at the end of the 500 ms pulse. C, ICl,Ca in a rare cell that had very small Ibkg and ICl,ir currents in the absence of Zn2+. D-F, Cl dependence of ICl,Ca. ICl,Ca was activated by a 750 ms pulse to +80 mV and the amplitude of the tail currents at different potentials was measured with 125.6 mm (D) or 30.6 mm (E) [Cl]o. ICl,ir and Ibkg were blocked with 1 mm Zn2+. F, instantaneous current-voltage relationships of ICl,Ca recorded in low (○) and normal (▪) extracellular [Cl].
Figure 11
Figure 11. Kinetics of ICl,Ca
A, tail currents of ICl,Ca were fitted to single exponentials. B, time constants of tail current deactivation (determined by fits in A) were dependent on membrane potential as expected from a voltage-dependent step in channel gating. These data are from the same experiment as shown in Fig. 10.
Figure 12
Figure 12. Stimulation of ICl,Ca by extracellular Ca2+
Standard intracellular solution contained 5 mm EGTA and no added Ca2+. Voltage clamp protocol is shown above panel A. A, when the bath solution contained 1.8 mm Ca2+, only a small time-dependent outward current was observed. Deactivating tail currents at −100 mV were not seen. B, increasing bath [Ca2+] to 10 mm stimulated outward current and a large deactivating tail current (arrow) was observed. C, current-voltage relationships of the currents in A and B. ○, 10 mm[Ca2+]o. ▪, 1.8 mm[Ca2+]o.
Figure 13
Figure 13. cAMP-stimulated current
The voltage clamp protocol was a series of 750 ms duration pulses from a holding potential of 0 mV to potentials between −100 mV and 100 mV in 20 mV steps. A, control traces before addition of 20 μm forskolin and 100 μm IBMX to the bath. B, traces 5 min after addition of forskolin + IBMX. C, traces 5 min after washout of forskolin + IBMX. D, time course of the effect of forskolin + IBMX. Forskolin + IBMX was applied for the period indicated. The bath was < 0.2 ml and the bath was changed at a rate of 4 ml min−1. E, current-voltage relationships of the currents shown in panels A-C. ▴, control current. ▪, 5 min after addition of forskolin + IBMX. •, 5 min after washout of forskolin + IBMX. F, I-V curve of the forskolin + IBMX-stimulated current obtained by subtracting the control current from the current in the presence of forskolin + IBMX in panel E. G, average increase in current in response to forskolin + IBMX. Currents were measured at +100 mV and −100 mV. The current 3–5 min after addition of forskolin + IBMX was divided by the current before forskolin + IBMX (n = 14). H, average effect of washout of forskolin + IBMX. The current 5 min after washing out forskolin + IBMX was divided by the current before forskolin + IBMX (n = 5).
Figure 14
Figure 14. Working model of RPE transport
This model comes largely from the work of Miller and colleagues (Gallemore et al. 1997). The RPE cell is drawn above the photoreceptor (rod). Left panel: RPE transport in the light. Right panel: RPE transport in the dark. The apical membrane contains the Na+-K+-ATPase, the Na+-K+-2Cl cotransporter, and the Na-bicarbonate exchanger. The basolateral membrane contains a K+ channel, at least one type of Cl channel, and the Cl-HCO3 exchanger. The size of the arrows suggests relative magnitude of flux. In the dark, the membrane potential of the RPE cell is depolarized by the external K+ provided by the photoreceptor dark current. In light the membrane is hyperpolarized. The change in membrane potential alters the driving force for the Na+-HCO3 transporter and cytosolic pH, which affects the Cl-HCO3 transporter. The net result is a decreased ‘recycling’ of Cl at the basolateral membrane in the light so that net Cl flux changes direction from basal-to-apical in the dark to apical-to-basal in light.

References

    1. Arreola J, Begenisich T, Melvin JE. Conformation-dependent regulation of inward rectifier chloride channel gating by extracellular protons. J Physiol. 2002;541:103–112. - PMC - PubMed
    1. Besharse JC, Defoe D. The role of retinal pigment epithelium in photoreceptor membrane turnover. In: Marmor MF, Wolfensberger TJ, editors. The Retinal Pigment Epithelium: Function and Disease. New York: Oxford University Press; 1998. pp. 152–172.
    1. Bialek S, Miller SS. K+ and Cl− transport mechanisms in bovine pigment epithelium that can modulate subretinal space volume and composition. J Physiol. 1994;475:401–417. - PMC - PubMed
    1. Bosl MR, Stein V, Hubner C, Zdebik AA, Jordt SE, Mukhopadhyay AK, Davidoff MS, Holstein AF, Jentsch TJ. Male germ cells and photoreceptors, both dependent on close cell-cell interactions, degenerate upon ClC-2 Cl− channel disruption. EMBO Journal. 2001;20:1289–1299. - PMC - PubMed
    1. Botchkin LM, Matthews G. Chloride current activated by swelling in retinal pigment epithelium cells. Am J Physiol. 1993;265:C1037–1045. - PubMed

Publication types

MeSH terms

LinkOut - more resources