Highly H+-sensitive neurons in the caudal ventrolateral medulla of the rat
- PMID: 12665611
- PMCID: PMC2342924
- DOI: 10.1113/jphysiol.2002.036624
Highly H+-sensitive neurons in the caudal ventrolateral medulla of the rat
Abstract
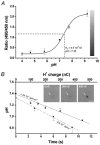
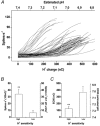
The ventral surface of the caudal ventrolateral medulla (cVLM) has been shown to generate intense respiratory responses after surface acid-base stimulation. With respect to their chemosensitive characteristics, cVLM neurons have been less studied than other rostral-most regions of the brainstem. The purpose of these experiments was to determine the bioelectric responses of cVLM neurons to acidic stimuli and to determine their chemosensitive properties. Using extracellular and microiontophoretic techniques, we recorded electrical activities from 117 neurons in an area close to the ventral surface of the cVLM in anaesthetised rats. All neurons were tested for their sensitivity to H+. The fluorescent probe BCECF was used to measure extracellular pH changes produced by the microiontophoretic injection of H+ in brainstem slices. This procedure provided an estimation of the local changes in pH produced by microiontophoretic H+ application in the anaesthetised rat. Neurons coupled to the respiratory cycle, R (n = 51), were not responsive to direct stimulation with H+. Sixty-six neurons that did respond to H+ stimulation were uncoupled from respiration, and identified as NR neurons. These neurons presented distinct ranges of H+ sensitivity. The neuronal sensitivity to H+ was mainly assessed by the slope of the stimulus-response curve, where the steeper the slope, the higher the H+ sensitivity. On this basis, NR neurons were classed as being either weakly or highly sensitive to H+. NR neurons with a high H+ sensitivity (n = 12) showed an average value of 34.17 +/- 7.44 spikes s-1 (100 nC)-1 (mean +/- S.D.) for maximal slope and an EC50 of 126.76 +/- 33 nC. Suprathreshold H+ stimulation of highly sensitive NR neurons elicited bursting pattern responses coupled to the respiratory cycle. The bursting responses, which were synchronised with the inspiratory phase and the early expiratory phase of the respiratory cycle, lasted for several seconds before returning to the steady state firing pattern characteristic of the pre-stimulus condition. These NR neurons, which possess the capacity to detect distinct H+ concentrations in the extracellular microenvironment, are excellent candidates to serve in a chemoreceptor capacity in the caudal medulla.
Figures


Similar articles
-
Baro-excited neurons in the caudal ventrolateral medulla (CVLM) recorded using the whole-cell patch-clamp technique.Hypertens Res. 2012 May;35(5):500-6. doi: 10.1038/hr.2011.211. Epub 2011 Dec 8. Hypertens Res. 2012. PMID: 22158117
-
Membrane and synaptic properties of nucleus tractus solitarius neurons projecting to the caudal ventrolateral medulla.Auton Neurosci. 2007 Oct 30;136(1-2):69-81. doi: 10.1016/j.autneu.2007.04.006. Epub 2007 May 29. Auton Neurosci. 2007. PMID: 17537680
-
Close appositions between tyrosine hydroxylase immunoreactive boutons and respiratory neurons in the rat ventrolateral medulla.J Comp Neurol. 1994 Feb 1;340(1):1-10. doi: 10.1002/cne.903400102. J Comp Neurol. 1994. PMID: 7909820
-
Chemosensitivity of serotonergic neurons in the rostral ventral medulla.Respir Physiol. 2001 Dec;129(1-2):175-89. doi: 10.1016/s0034-5687(01)00289-4. Respir Physiol. 2001. PMID: 11738653 Review.
-
Mammalian brainstem chemosensitive neurones: linking them to respiration in vitro.J Physiol. 2000 Jun 15;525 Pt 3(Pt 3):567-77. doi: 10.1111/j.1469-7793.2000.00567.x. J Physiol. 2000. PMID: 10856112 Free PMC article. Review.
Cited by
-
Redefining the components of central CO2 chemosensitivity--towards a better understanding of mechanism.J Physiol. 2011 Dec 1;589(Pt 23):5561-79. doi: 10.1113/jphysiol.2011.214759. Epub 2011 Oct 17. J Physiol. 2011. PMID: 22005672 Free PMC article. Review.
-
Connexin26 mediates CO2-dependent regulation of breathing via glial cells of the medulla oblongata.Commun Biol. 2020 Sep 21;3(1):521. doi: 10.1038/s42003-020-01248-x. Commun Biol. 2020. PMID: 32958814 Free PMC article.
-
Central respiratory chemoreception.J Comp Neurol. 2010 Oct 1;518(19):3883-906. doi: 10.1002/cne.22435. J Comp Neurol. 2010. PMID: 20737591 Free PMC article. Review.
-
Central chemoreceptors: locations and functions.Compr Physiol. 2012 Jan;2(1):221-54. doi: 10.1002/cphy.c100083. Compr Physiol. 2012. PMID: 23728974 Free PMC article. Review.
-
CO2 sensing by connexin26 and its role in the control of breathing.Interface Focus. 2021 Apr 6;11(2):20200029. doi: 10.1098/rsfs.2020.0029. Epub 2021 Feb 12. Interface Focus. 2021. PMID: 33633831 Free PMC article. Review.
References
-
- Bayliss DA, Talley EM, Sirois JE, Lei Q. TASK-1 is a highly modulated pH-sensitive ‘leak’ K(+) channel expressed in brainstem respiratory neurons. Respir Physiol. 2001;129:159–174. - PubMed
-
- Berndt J, Berger W, Berger K, Schmidt M. Studies on the central chemosensitive mechanism of respiration. II. Control of respiration by the extracellular pH in medullary tissue. Pflugers Arch. 1972;332:146–170. - PubMed
-
- Berquin P, Bodineau L, Gros F, Larnicol N. Brainstem and hypothalamic areas involved in respiratory chemoreflexes: a Fos study in adult rats. Brain Res. 2000;857:30–40. - PubMed
Publication types
MeSH terms
Substances
LinkOut - more resources
Full Text Sources

