Comparative Study
. 2003 Apr;84(4):2671-90.
doi: 10.1016/S0006-3495(03)75073-5.

The state diagram for cell adhesion mediated by two receptors

Affiliations
Comparative Study

The state diagram for cell adhesion mediated by two receptors

Sujata K Bhatia et al. Biophys J. 2003 Apr.

Abstract

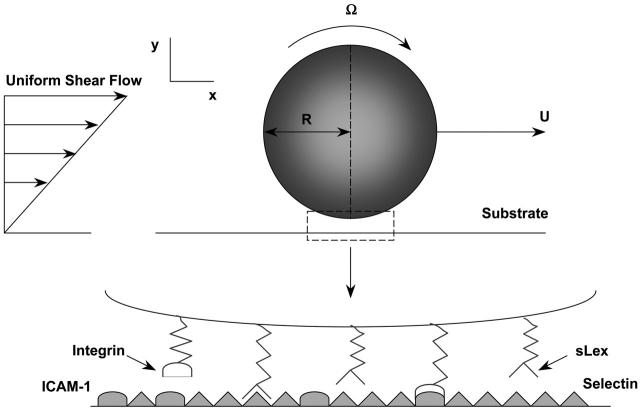
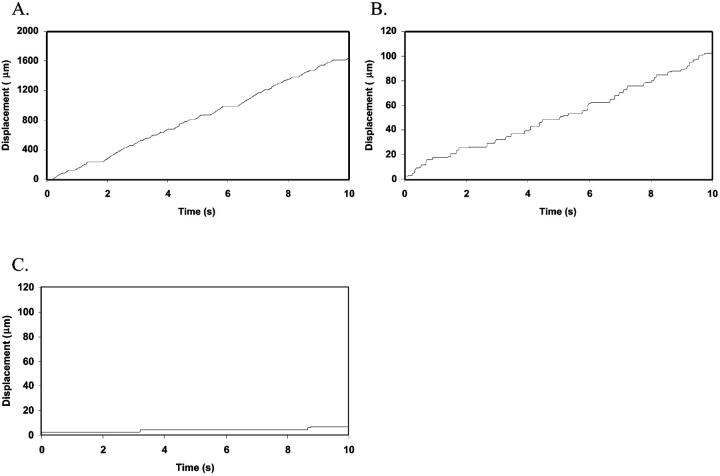
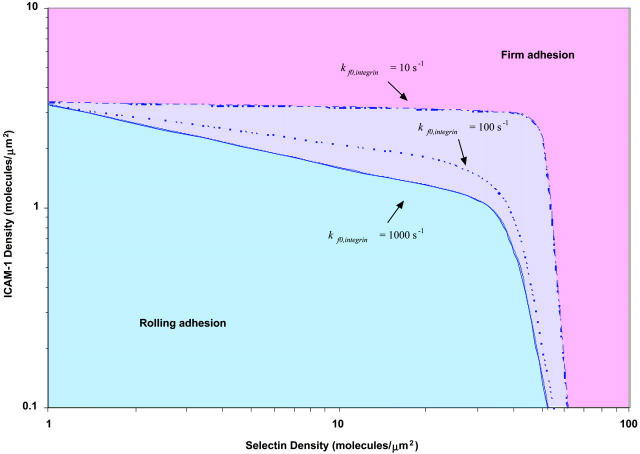
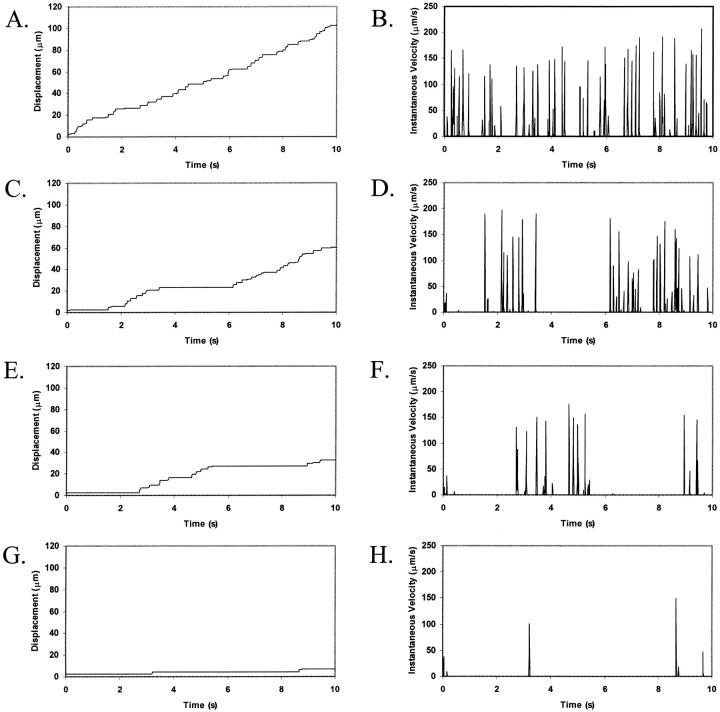
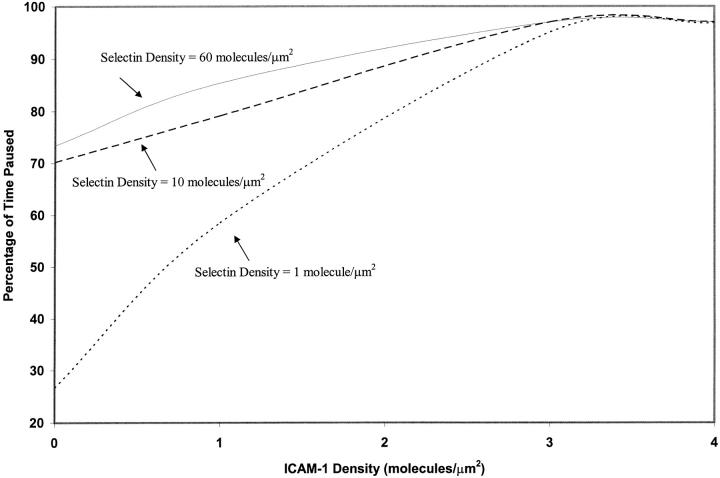
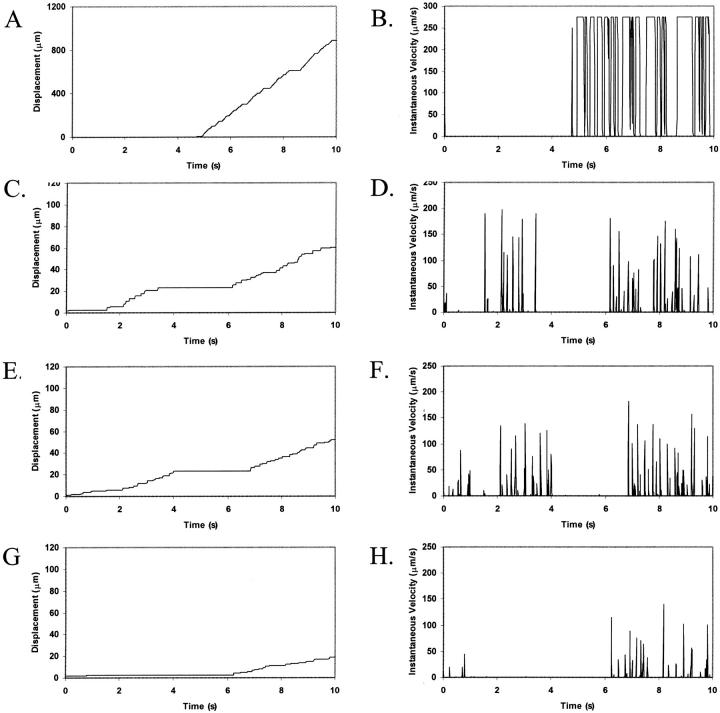
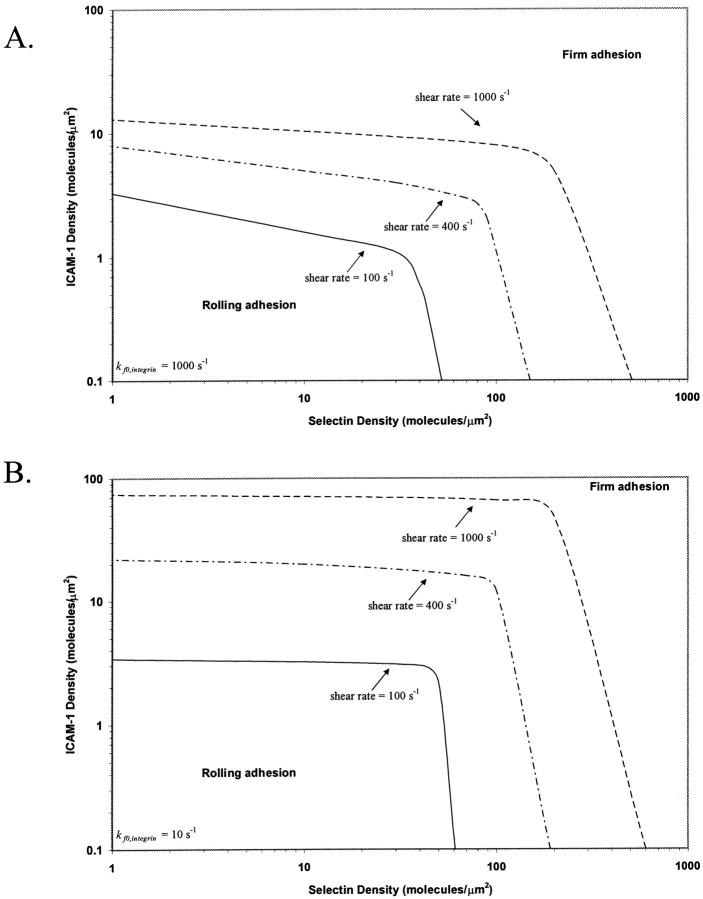
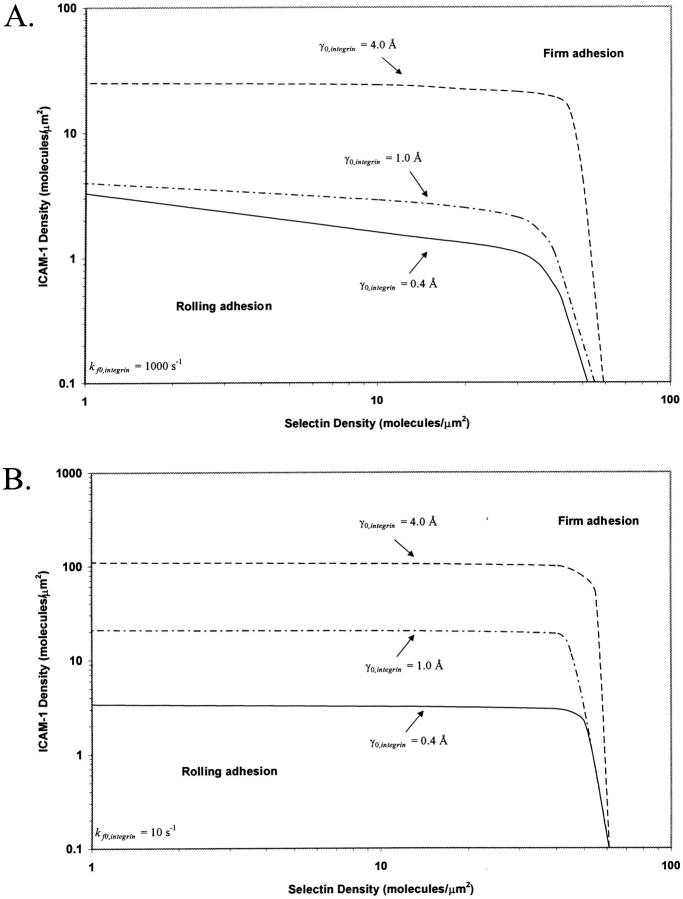
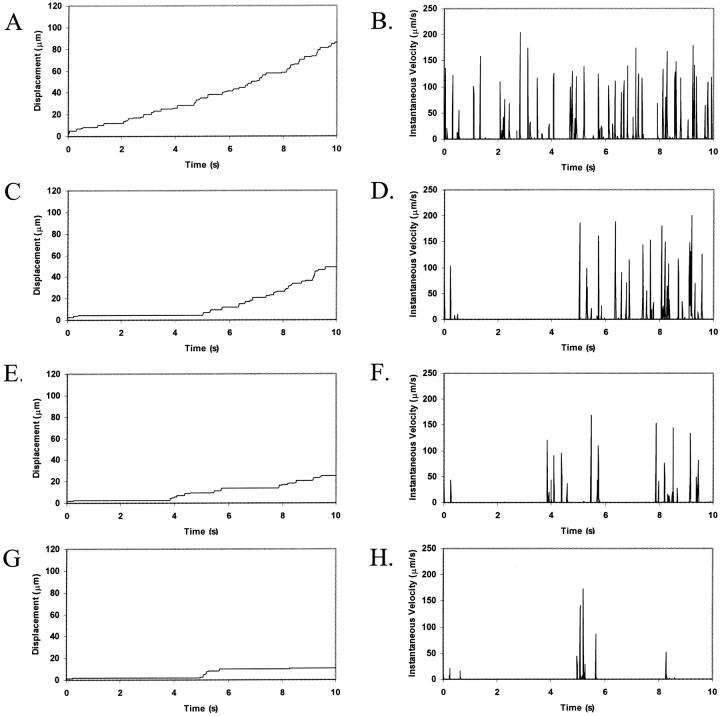
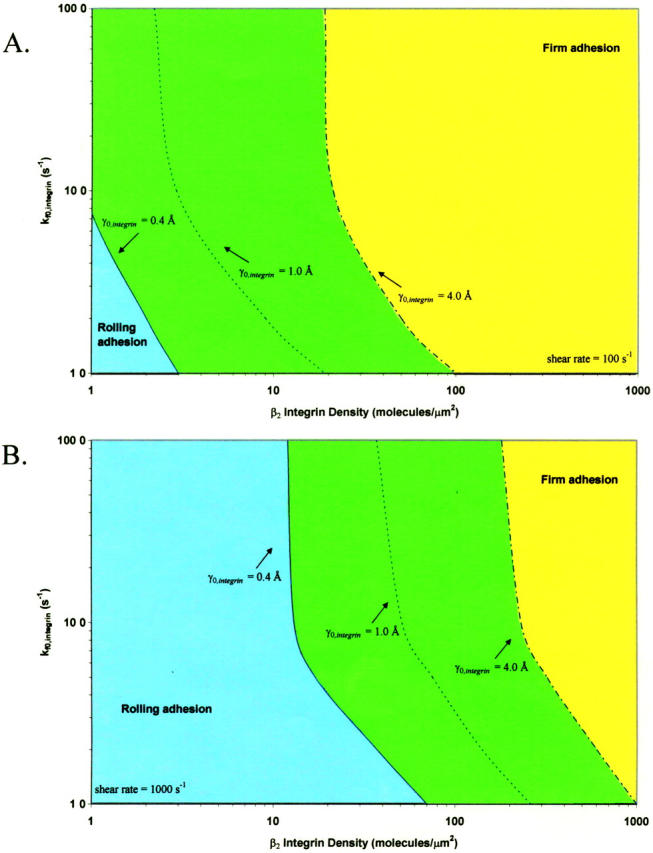
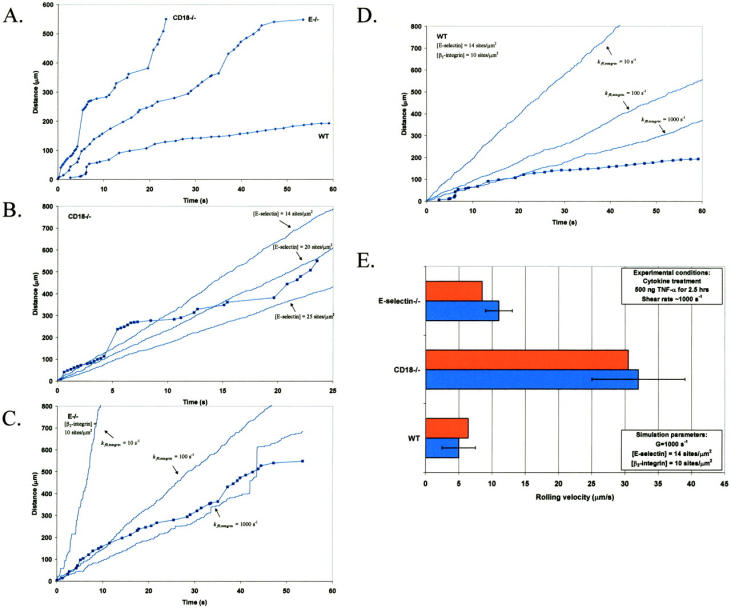
Leukocyte recruitment from the bloodstream to surrounding tissues is an essential component of the immune response. Capture of blood-borne leukocytes onto vascular endothelium proceeds via a two-step mechanism, with each step mediated by a distinct receptor-ligand pair. Cells first transiently adhere, or "roll" (via interactions between selectins and sialyl-Lewis-x), and then firmly adhere to the vascular wall (via interactions between integrins and ICAM-1). We have reported that a computational method called adhesive dynamics (AD) accurately reproduces the fine-scale dynamics of selectin-mediated rolling. This paper extends the use of AD simulations to model the dynamics of cell adhesion when two classes of receptors are simultaneously active: one class (selectins or selectin ligands) with weakly adhesive properties, and the other (integrins) with strongly adhesive properties. AD simulations predict synergistic functions of the two receptors in mediating adhesion. At a fixed density of surface ICAM-1, increasing selectin densities lead to greater pause times and an increased tendency toward firm adhesion; thus, selectins mechanistically facilitate firm adhesion mediated by integrins. Conversely, at a fixed density of surface selectin, increasing ICAM-1 densities lead to greater pause times and an increased tendency to firm adhesion. We present this relationship in a two-receptor state diagram, a map that relates the densities and properties of adhesion molecules to various adhesive behaviors that they code, such as rolling or firm adhesion. We also present a state diagram for neutrophil activation, which relates beta(2)-integrin density and integrin-ICAM-1 kinetic on rate to neutrophil adhesive behavior. The predictions of two-receptor adhesive dynamics are validated by the ability of the model to reproduce in vivo neutrophil rolling velocities from the literature.


Figures

FIGURE 1
FIGURE 1
Schematic diagram of adhesive dynamics. Adhesion molecules are randomly placed on the surface of a sphere and plane wall. Adhesive receptor-ligand pairs are tested for bond formation according to deviation length-dependent binding kinetics.
FIGURE 2
FIGURE 2
Representative cell trajectories for adhesive behavior states. (A) No adhesion is observed at a selectin density of 1 molecule/μm2 and an ICAM-1 density of 0 sites/μm2. The ratio of cell velocity to hydrodynamic velocity, V/VH, is 60%. (B) Rolling adhesion is observed at a selectin density of 10 molecules/μm2 and an ICAM-1 density of 0 sites/μm2. V/VH is 4%. (C) Firm adhesion is observed at a selectin density of 10 molecules/μm2 and an ICAM-1 density of 4 sites/μm2. V/VH is 0.3%. Calculations are performed with an integrin-ICAM-1 association rate of kf0,integrin = 1000 s−1.
FIGURE 3
FIGURE 3
The state diagram for adhesion mediated by two receptors. The boundary of rolling adhesion is shown for three different integrin-ICAM-1 association rates: kf0,integrin = 1000, 100, and 10 s−1. For each rolling state, the boundary represents a mean velocity of 0.02 VH.
FIGURE 4
FIGURE 4
Effect of ICAM-1 site density on cell trajectories and instantaneous velocity distributions. The surface density of selectin is 10 molecules/μm2. ICAM-1 surface density is (A and B) 0 molecules/μm2; (C and D) 1 molecule/μm2; (E and F) 2 molecules/μm2; and (G and H) 4 molecules/μm2. Calculations are performed with an integrin-ICAM-1 association rate of kf0,integrin = 1000 s−1.
FIGURE 5
FIGURE 5
Percentage of time paused as a function of ICAM-1 site density and selectin site density, calculated at kf0,integrin = 1000 s−1.
FIGURE 6
FIGURE 6
Effect of selectin-site density on cell trajectories and instantaneous velocity distributions. The surface density of ICAM-1 is 1 molecule/μm2. Selectin surface density is (A and B) 1 molecule/μm2; (C and D) 10 molecules/μm2; (E and F) 30 molecules/μm2; and (G and H) 60 molecules/μm2. Calculations are performed with an integrin-ICAM-1 association rate of kf0,integrin = 1000 s−1.
FIGURE 7
FIGURE 7
The state diagram with shear rate ranging from 100 to 1000 s−1. The boundary of rolling adhesion is shown for three different shear rates (100, 400, and 1000 s−1), calculated at an integrin-ICAM-1 association rate of (A) kf0,integrin = 1000 s−1 and (B) kf0,integrin = 10 s−1. For each rolling state, the boundary represents a mean velocity of 0.02 VH.
FIGURE 8
FIGURE 8
The boundary of rolling adhesion for three different integrin-ICAM-1 reactive compliances (γ0,integrin = 0.4, 1.0, and 4.0 Å), calculated at an integrin-ICAM-1 association rate of (A) kf0,integrin = 1000 s−1 and (B) kf0,integrin = 10 s−1. For each rolling state, the boundary represents a mean velocity of 0.02 VH.
FIGURE 9
FIGURE 9
Effect of β2-integrin cell surface density on cell trajectories and instantaneous velocity distributions. The surface density of ICAM-1 is 5 molecules/μm2, and the surface density of selectin is 15 molecules/μm2. β2-integrin site density is (A and B) 0 molecules/μm2; (C and D) 1 molecule/μm2; (E and F) 2 molecules/μm2; and (G and H) 4 molecules/μm2. Calculations are performed with an integrin-ICAM-1 association rate of kf0,integrin = 1000 s−1.
FIGURE 10
FIGURE 10
The state diagram for neutrophil activation. The boundary of rolling adhesion is shown for three different integrin-ICAM-1 reactive compliances (γ0,integrin = 0.4, 1.0, and 4.0 Å), calculated at a shear rate of (A) 100 s−1 and (B) 1000 s−1. The surface density of ICAM-1 is 1000 molecules/μm2, and the surface density of selectin is 40 molecules/μm2. For each rolling state, the boundary represents a mean velocity of 0.02 VH.
FIGURE 11
FIGURE 11
Comparison of two-receptor adhesive dynamic simulations to experiment. (A) Representative neutrophil rolling trajectories in wild-type, CD18−/−, and E−/− mice, as reported in Forlow et al. (2000). (B) Comparison of experimental CD18−/− neutrophil rolling trajectory to simulated cell motion; calculated results for three different selectin densities (14, 20, 25 sites/μm2) are shown. (C) Comparison of experimental E−/− neutrophil rolling trajectory to simulated cell motion; calculated results for three different integrin-ICAM-1 association rates (10, 100, 1000 s−1) are shown. (D) Comparison of experimental wild-type neutrophil rolling trajectory to simulated cell motion; calculated results for three different integrin-ICAM-1 association rates (10, 100, 1000 s−1) are shown. (E) Comparison of average neutrophil rolling velocities, as reported by Kunkel et al. (2000), to average rolling velocities predicted by simulations; this calculation is performed at kf0,integrin = 1000 s−1. Experimental velocities are represented by blue bars, and simulated results are represented by red bars.

References

    1. Alon, R., D. A. Hammer, and T. A. Springer. 1995. Lifetime of the P-selectin-carbohydrate bond and its response to tensile force in hydrodynamic flow. Nature. 374:539–542. - PubMed
    1. Bell, G. I. 1978. Models for the specific adhesion of cells to cells. Science. 200:618–627. - PubMed
    1. Bell, G. I., M. Dembo, and P. Bongrand. 1984. Competition between non-specific repulsion and specific bonding. Biophys. J. 45:1051–1064. - PMC - PubMed
    1. Blanks, J. E., T. Moll, R. Eytner, and D. Vestweber. 1998. Stimulation of P-selectin glycoprotein ligand-1 on mouse neutrophils activates beta 2-integrin mediated cell attachment to ICAM-1. Eur. J. Immunol. 28:433–443. - PubMed
    1. Brenner, B., E. Gulbins, K. Schlottmann, U. Koppenhoefer, G. L. Busch, B. Walzog, M. Steinhausen, K. M. Coggeshall, O. Linderkamp, and F. Lang. 1996. L-selectin activates the Ras pathway via the tyrosine kinase p56lck. Proc. Natl. Acad. Sci. USA. 93:15376–15381. - PMC - PubMed

Publication types

MeSH terms