Comparative Study
. 2003 Apr;185(8):2512-9.
doi: 10.1128/JB.185.8.2512-2519.2003.

Regulation of the alternative sigma factor sigma(E) during initiation, adaptation, and shutoff of the extracytoplasmic heat shock response in Escherichia coli

Affiliations
Comparative Study

Regulation of the alternative sigma factor sigma(E) during initiation, adaptation, and shutoff of the extracytoplasmic heat shock response in Escherichia coli

Sarah E Ades et al. J Bacteriol. 2003 Apr.

Abstract

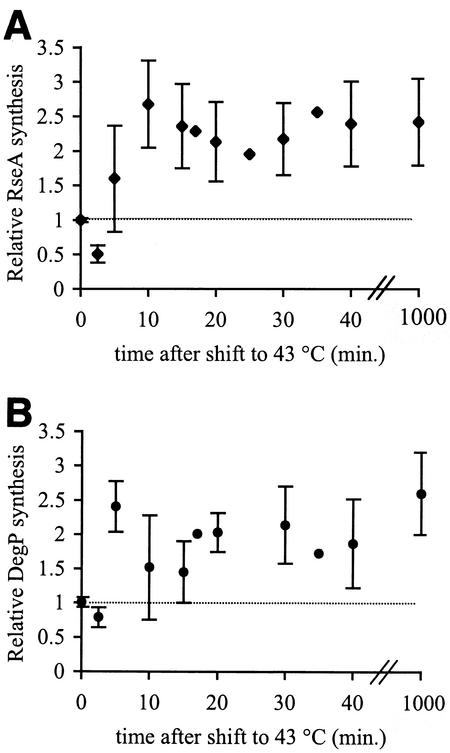
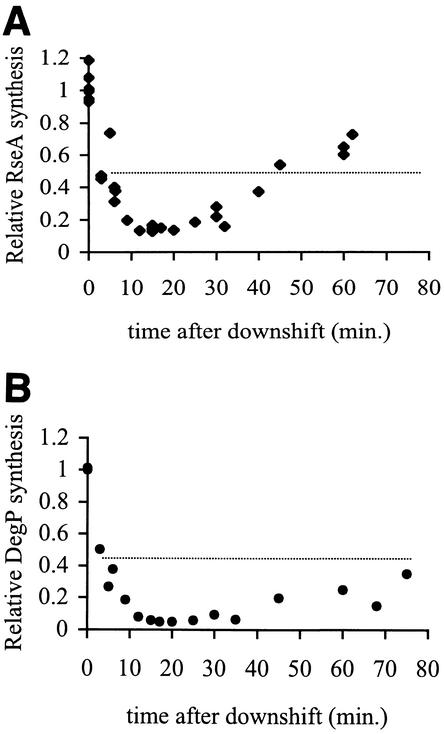
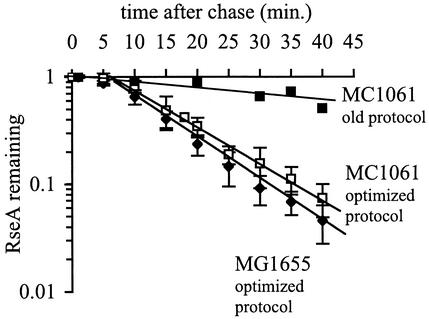
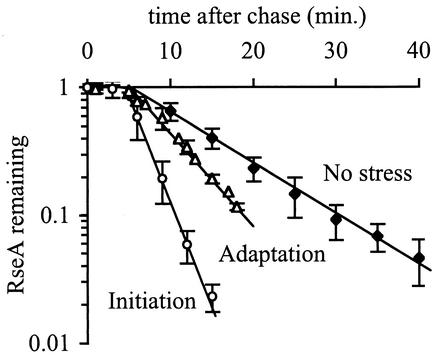
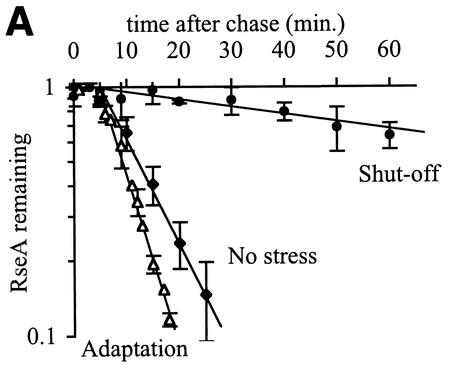
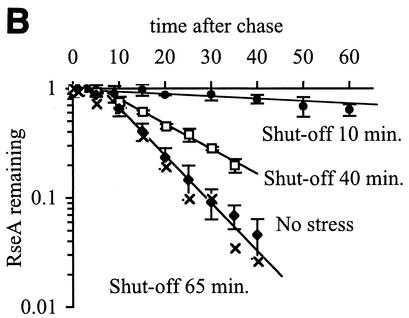
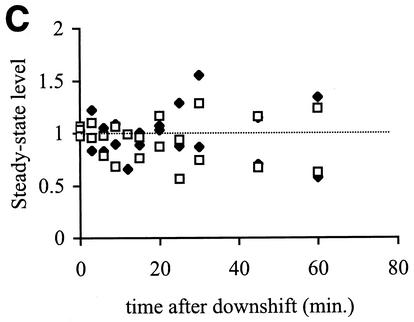
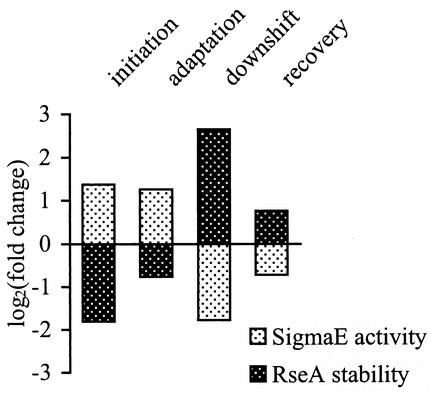
The alternative sigma factor sigma(E) is activated in response to stress in the extracytoplasmic compartment of Escherichia coli. Here we show that sigma(E) activity increases upon initiation of the stress response by a shift to an elevated temperature (43 degrees C) and remains at that level for the duration of the stress. When the stress is removed by a temperature downshift, sigma(E) activity is strongly repressed and then slowly returns to levels seen in unstressed cells. We provide evidence that information about the state of the cell envelope is communicated to sigma(E) primarily through the regulated proteolysis of the inner membrane anti-sigma factor RseA, as the degradation rate of RseA is correlated with the changes in sigma(E) activity throughout the stress response. However, the relationship between sigma(E) activity and the rate of degradation of RseA is complex, indicating that other factors may cooperate with RseA and serve to fine-tune the response.


Figures

FIG. 1.
FIG. 1.
E activity increases during the initiation and adaptation phases of the stress response. Cells were grown to early exponential phase at 30°C and then shifted to 43°C. EσE activity was determined by measuring the rates of synthesis of RseA (A) and DegP (B) using the pulse-label protocol described in Materials and Methods. The synthesis rate shown for each protein is normalized to the synthesis rate of that protein at 30°C before the shift to 43°C (t = 0). The dotted line indicates the average synthesis rate in unstressed cells at 30°C. Error bars are shown for data points representing the average of at least two independent determinations.
FIG. 2.
FIG. 2.
E activity decreases during the shutoff phase of the stress response and then slowly returns to normal levels. Cells were grown overnight at 43°C, diluted, regrown into early exponential phase at 43°C, and then shifted to 30°C. EσE activity was determined by measuring the rates of synthesis of RseA (A) and DegP (B) using the pulse-label protocol described in Materials and Methods. The synthesis rate shown for each protein is normalized to the synthesis rate of that protein at 43°C, before the downshift to 30°C (t = 0). The dotted line indicates the average synthesis rate in unstressed cells at 30°C. Data points from several experiments are shown.
FIG. 3.
FIG. 3.
RseA is degraded in unstressed cells. Cells of E. coli strains MG1655 and MC1061 were grown to early exponential phase at 30°C, and RseA stability was measured using the optimized protocol described in Materials and Methods. The stability of MC1061 measured using the old protocol (1) is shown for reference. The data points and error bars shown are the averages and standard deviations, respectively, from four independent experiments.
FIG. 4.
FIG. 4.
RseA is degraded faster during the initiation and adaptation phases of the stress response than in unstressed cells. Cells were grown to early exponential phase and left at 30°C (no stress), shifted to 43°C (initiation), or grown to early exponential phase at 43°C (adaptation). RseA stability was measured by a pulse-chase protocol as described in Materials and Methods. The stability of RseA during the initiation phase was measured 5 to 10 min after the shift to 43°C. The data points and error bars shown are the averages and standard deviations, respectively, from a minimum of three independent experiments.
FIG. 5.
FIG. 5.
RseA is stabilized, but the steady-state levels of RseA and σE do not change during the shutoff phase of the stress response. (A) RseA degradation is significantly slower after a shift from 43 to 30°C than during steady-state growth at 43 or 30°C. Cells were grown to early exponential phase at 30°C (no stress), grown to early exponential phase and left at 43°C (adaptation), or grown to early exponential phase at 43°C and then shifted to 30°C (shutoff). RseA stability was measured by a pulse-chase protocol, as described in Materials and Methods. The stability of RseA during the shutoff phase was measured 10 min after the shift to 30°C. The data points and error bars shown are the averages and standard deviations, respectively, from a minimum of three independent experiments. (B) RseA is stabilized immediately after a shift from 43 to 30°C and then becomes progressively less stable as the cells remain at 30°C. Cells were grown to early exponential phase at 43°C and shifted to 30°C (shutoff) or grown to early exponential phase at 30°C (no stress). RseA stability was measured 10, 40, and 65 min after the temperature shift. Data points and error bars are the averages and standard deviations, respectively, from a minimum of two independent experiments. A representative data set is shown for the 65-min shutoff experiment. (C) The steady-state levels of RseA and σE do not change after a shift from 43 to 30°C. Cells were grown to early exponential phase at 43°C and then shifted to 30°C. The levels of RseA (⧫) and σE (□) were determined before the temperature shift (t = 0) and at various times after the shift by Western blot analysis as described in Materials and Methods. The amount of each protein at a given time is normalized to the amount of that protein at t = 0. The dotted line indicates a normalized steady-state level of 1. Data from two independent experiments are shown.
FIG. 5.
FIG. 5.
RseA is stabilized, but the steady-state levels of RseA and σE do not change during the shutoff phase of the stress response. (A) RseA degradation is significantly slower after a shift from 43 to 30°C than during steady-state growth at 43 or 30°C. Cells were grown to early exponential phase at 30°C (no stress), grown to early exponential phase and left at 43°C (adaptation), or grown to early exponential phase at 43°C and then shifted to 30°C (shutoff). RseA stability was measured by a pulse-chase protocol, as described in Materials and Methods. The stability of RseA during the shutoff phase was measured 10 min after the shift to 30°C. The data points and error bars shown are the averages and standard deviations, respectively, from a minimum of three independent experiments. (B) RseA is stabilized immediately after a shift from 43 to 30°C and then becomes progressively less stable as the cells remain at 30°C. Cells were grown to early exponential phase at 43°C and shifted to 30°C (shutoff) or grown to early exponential phase at 30°C (no stress). RseA stability was measured 10, 40, and 65 min after the temperature shift. Data points and error bars are the averages and standard deviations, respectively, from a minimum of two independent experiments. A representative data set is shown for the 65-min shutoff experiment. (C) The steady-state levels of RseA and σE do not change after a shift from 43 to 30°C. Cells were grown to early exponential phase at 43°C and then shifted to 30°C. The levels of RseA (⧫) and σE (□) were determined before the temperature shift (t = 0) and at various times after the shift by Western blot analysis as described in Materials and Methods. The amount of each protein at a given time is normalized to the amount of that protein at t = 0. The dotted line indicates a normalized steady-state level of 1. Data from two independent experiments are shown.
FIG. 6.
FIG. 6.
Changes in σE activity are inversely correlated with changes in RseA stability. σE activity (the synthesis rate of RseA) and the half-life of RseA during the initiation, adaptation, shutoff, and recovery from shutoff (40 min after the temperature downshift) were normalized to those values measured in unstressed cells at 30°C. The log2 values of the fold changes are plotted such that no change gives a value of 0, a twofold increase gives a value of 1, a twofold decrease gives a value of −1, etc.

References

    1. Ades, S. E., L. E. Connolly, B. M. Alba, and C. A. Gross. 1999. The Escherichia coli sigmaE-dependent extracytoplasmic stress response is controlled by the regulated proteolysis of an anti-sigma factor. Genes Dev. 13:2449-2461. - PMC - PubMed
    1. Alba, B. M., J. A. Leeds, C. Onufryk, C. Z. Lu, and C. A. Gross. 2002. DegS and YaeL participate sequentially in the cleavage of RseA to activate the sigmaE-dependent extracytoplasmic stress response. Genes Dev. 16:2156-2168. - PMC - PubMed
    1. Alba, B. M., H. J. Zhong, J. C. Pelayo, and C. A. Gross. 2001. degS (hhoB) is an essential Escherichia coli gene whose indispensable function is to provide sigmaE activity. Mol. Microbiol. 40:1323-1333. - PubMed
    1. Baker, T. A., A. D. Grossman, and C. A. Gross. 1984. A gene regulating the heat shock response in Escherichia coli also affects proteolysis. Proc. Natl. Acad. Sci. USA 81:6779-6783. - PMC - PubMed
    1. Becker, J., and E. A. Craig. 1994. Heat-shock proteins as molecular chaperones. Eur. J. Biochem. 219:11-23. - PubMed

Publication types

MeSH terms