

Y chromosome STR haplotypes and the genetic structure of U.S. populations of African, European, and Hispanic ancestry
- PMID: 12671003
- PMCID: PMC430174
- DOI: 10.1101/gr.463003
Y chromosome STR haplotypes and the genetic structure of U.S. populations of African, European, and Hispanic ancestry
Abstract
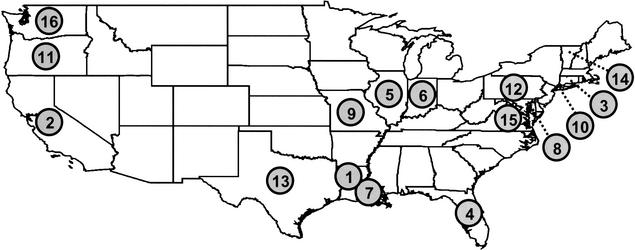
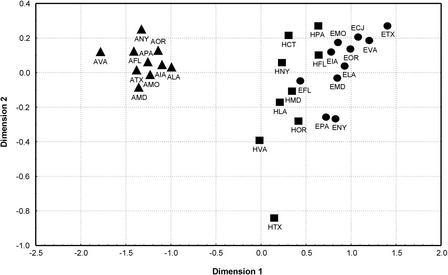
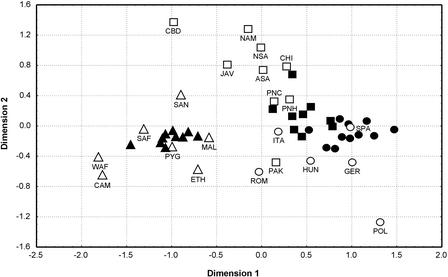
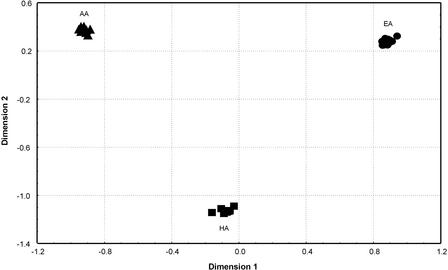
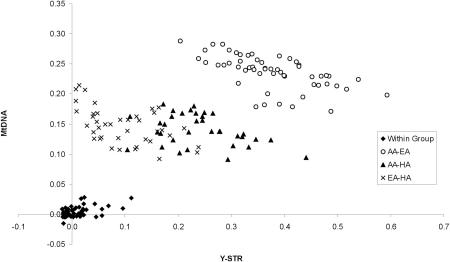
To investigate geographic structure within U.S. ethnic populations, we analyzed 1705 haplotypes on the basis of 9 short tandem repeat (STR) loci on the Y-chromosome from 9-11 groups each of African-Americans, European-Americans, and Hispanics. There were no significant differences in the distribution of Y-STR haplotypes among African-American groups, whereas European-American and Hispanic groups did exhibit significant geographic heterogeneity. However, the significant heterogeneity resulted from one sample; removal of that sample in each case eliminated the significant heterogeneity. Multidimensional scaling analysis of R(ST) values indicated that African-American groups formed a distinct cluster, whereas there was some intermingling of European-American and Hispanic groups. MtDNA data exist for many of these same groups; estimates of the European-American genetic contribution to the African-American gene pool were 27.5%-33.6% for the Y-STR haplotypes and 9%-15.4% for the mtDNA types. The lack of significant geographic heterogeneity among Y-STR and mtDNA haplotypes in U.S ethnic groups means that forensic DNA databases do not need to be constructed for separate geographic regions of the U.S. Moreover, absence of significant geographic heterogeneity for these two loci means that regional variation in disease susceptibility within ethnic groups is more likely to reflect cultural/environmental factors, rather than any underlying genetic heterogeneity.
Figures
References
-
- Bertorelle G. and Excoffier, L. 1998. Inferring admixture proportions from molecular data. Mol. Biol. Evol. 15: 1298-1311. - PubMed
-
- Budowle B., Shea, B., Niezgoda, S., and Chakraborty, R. 2001. CODIS STR loci data from 41 sample populations. J. Forensic Sci. 46: 453-489. - PubMed
-
- Caglia A., Novelletto, A., Dobosz, M., Malaspina, P., Ciminelli, B., and Pascali, V. 1997. Y-chromosome STR loci in Sardinia and continental Italy reveal islander-specific haplotypes. Eur. J. Hum. Genet. 5: 288-292. - PubMed
-
- Cavalli-Sforza L.L., Menozzi, P., and Piazza, A., 1994. The history and geography of human genes. Princeton University Press, Princeton, NJ.
-
- Chakraborty B.M., Fernandez-Esquer, M.E., and Chakraborty, R. 1999. Is being Hispanic a risk factor for non-insulin dependent diabetes mellitus (NIDDM)? Ethn. Dis. 9: 278-283. - PubMed
Publication types
MeSH terms
Substances
LinkOut - more resources
Full Text Sources
Other Literature Sources