. 2003 Apr;13(4):693-702.
doi: 10.1101/gr.634603.

Informatics for unveiling hidden genome signatures

Affiliations

Informatics for unveiling hidden genome signatures

Takashi Abe et al. Genome Res. 2003 Apr.

Abstract

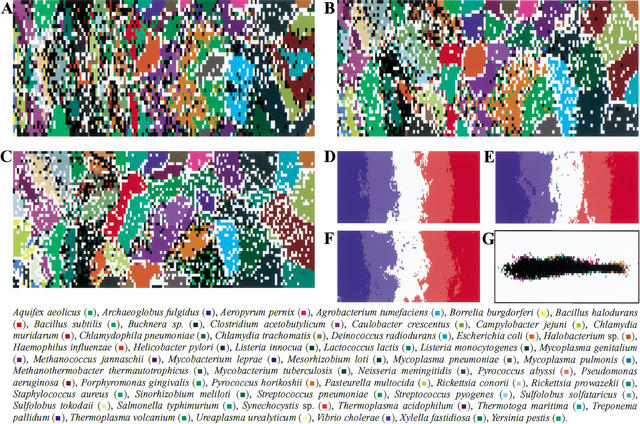
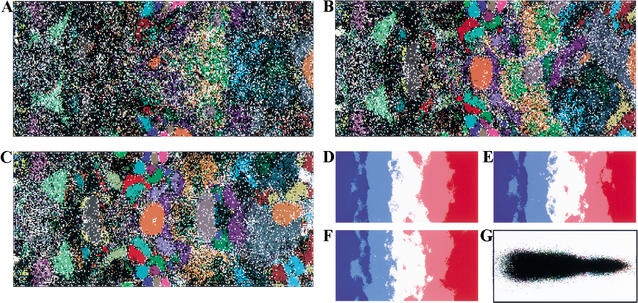
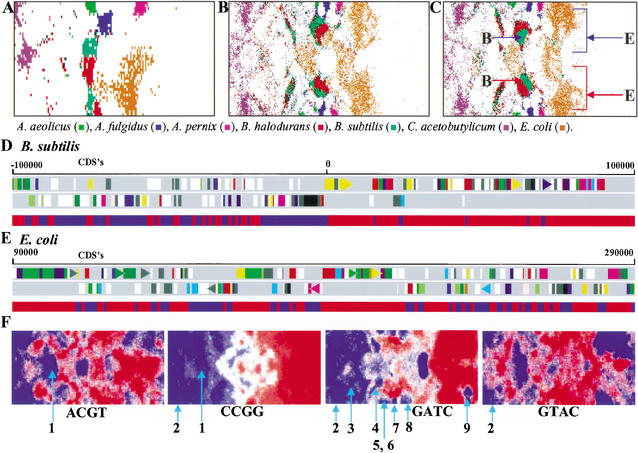
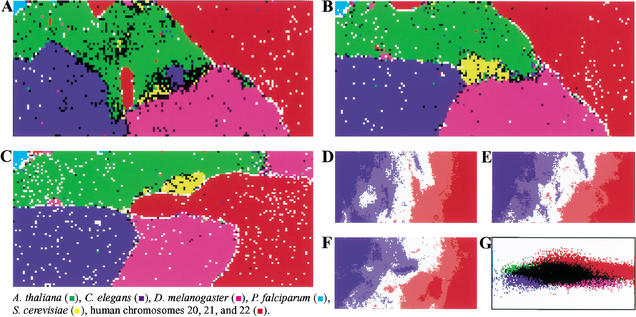
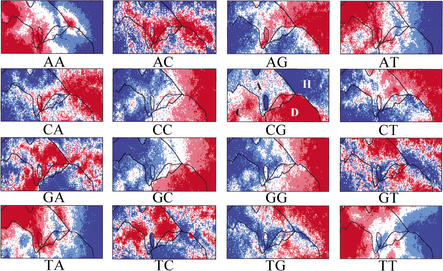
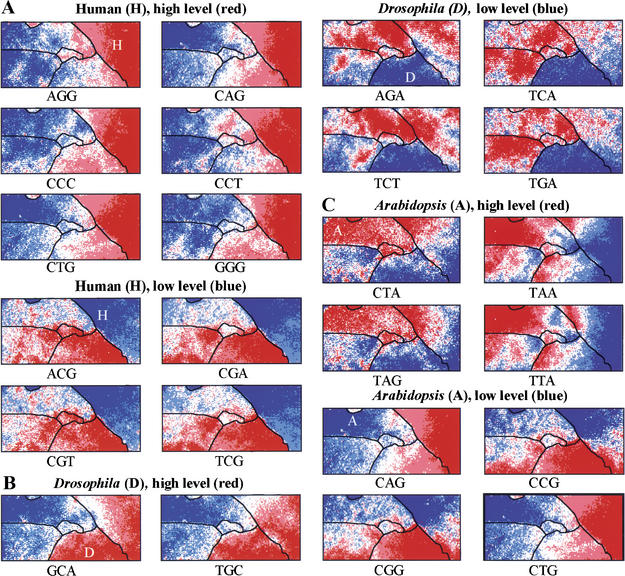
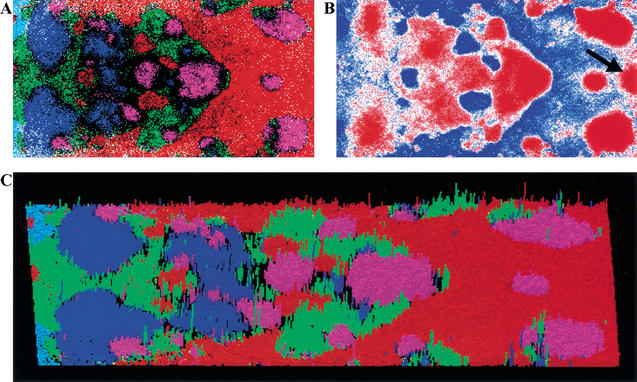
With the increasing amount of available genome sequences, novel tools are needed for comprehensive analysis of species-specific sequence characteristics for a wide variety of genomes. We used an unsupervised neural network algorithm, a self-organizing map (SOM), to analyze di-, tri-, and tetranucleotide frequencies in a wide variety of prokaryotic and eukaryotic genomes. The SOM, which can cluster complex data efficiently, was shown to be an excellent tool for analyzing global characteristics of genome sequences and for revealing key combinations of oligonucleotides representing individual genomes. From analysis of 1- and 10-kb genomic sequences derived from 65 bacteria (a total of 170 Mb) and from 6 eukaryotes (460 Mb), clear species-specific separations of major portions of the sequences were obtained with the di-, tri-, and tetranucleotide SOMs. The unsupervised algorithm could recognize, in most 10-kb sequences, the species-specific characteristics (key combinations of oligonucleotide frequencies) that are signature features of each genome. We were able to classify DNA sequences within one and between many species into subgroups that corresponded generally to biological categories. Because the classification power is very high, the SOM is an efficient and fundamental bioinformatic strategy for extracting a wide range of genomic information from a vast amount of sequences.


Figures

Figure 1.
Figure 1.
SOMs for 10-kb sequences of 65 bacterial genomes. (A,B,C) Di-, tri-, and tetra-SOMs, respectively. Lattices that include sequences from more than one species are indicated in black, and those that include sequences from a single species are indicated in color as detailed in the figure above. (D,E,F) G+C% for each weight vector in di-, tri-, and tetra-SOMs, respectively. G+C% for each lattice vector was divided into five categories containing an equal number of lattices. The highest, second-highest, middle, second-lowest, and lowest G+C% categories are shown in dark red, light red, white, light blue, and dark blue, respectively. (G) Classification by the initial weight vectors set by PCA for the di-SOM. Lattices are colored as described in A–C.
Figure 2.
Figure 2.
SOMs for 1-kb sequences of 65 bacterial genomes. (A,B,C) Di-, tri-, and tetra-SOMs, respectively. Lattices are colored as described in Fig. 1,A–C. (D,E,F) G+C% for each weight vector is shown as described in Fig. 1, D–F. (G) Classification by the initial weight vectors for the di-SOM.
Figure 3.
Figure 3.
Intraspecies separations and tetranucleotide distributions in SOMs for bacterial genomes. (A,B,C) The 10-kb tri-, 1-kb tri-, and 1-kb tetra-SOMs. Seven representative species with two major zones are indicated in color as detailed in the figure above. In C, the two major zones of B. subtilis or E. coli are noted with red or blue arrows with the letter B or E, respectively. (D) Transcriptional polarity and SOM separation for B. subtilis sequences. Two transcriptional polarities of CDSs in the 200-kb B. subtilis segment with a replication origin are presented separately in the top two panels; this was obtained from the DDBJ Web site (http://gib.genes.nig.ac.jp/). Below the two panels, contiguous 1-kb sequences within the 200-kb segment and belonging to the two major zones marked with red and blue arrows in C are shown separately with the red and blue bands, respectively. (E) Transcriptional polarity and SOM separation for E. coli sequences. A 200-kb E. coli segment lacking a replication origin was analyzed as described in D. (F) Tetranucleotide distribution in the 1-kb tetra-SOM for bacteria. Levels of each tetranucleotide for all lattice vectors in the tetra-SOM of Fig. 2C were divided into five categories containing an equal number of lattices, and the highest, second-highest, middle, second-lowest, and lowest categories are shown with different levels of red and blue as described in Fig. 1,D–F. Zones for bacteria that have genes encoding a restriction enzyme that recognizes the respective tetranucleotide are noted by light blue lines with the following numbers to show the species name: (1) H. pylori; (2) M. jannaschii; (3) S. aureus; (4) S. pneumoniae; (5) P. abyssi; (6) P. horikoshii; (7) A. fulgidus; (8) A. pernix; and (9) D. radiodurans. For other palindromic tetranucleotides, see Supplementary Data 2. Of 17 restriction enzymes from 11 bacteria, the respective tetranucleotides were under-represented in 15 instances.
Figure 4.
Figure 4.
SOM for 10-kb sequences of six eukaryotes. (A,B,C) Di-, tri-, and tetra-SOMs, respectively. Lattices that include sequences from more than one species are indicated in black, and those that include sequences from a single species are indicated in color as detailed in the figure above. (D,E,F) G+C% for each weight vector in di-, tri-, and tetra-SOMs, respectively. G+C% for each lattice vector is shown as described in Fig. 1, D–F. (G) Classification by the initial weight vectors for the di-SOM.
Figure 5.
Figure 5.
Dinucleotide distribution in 10-kb di-SOM for six eukaryotes. Levels of each dinucleotide for all lattice vectors in the di-SOM of Fig. 4A were divided into five categories containing an equal number of lattices and the categories are shown as described in Fig. 3F. Species borders in the di-SOM (Fig. 4A) are marked by lines. Major zones for four species were noted in the CG panel as follows: A. thaliana (A), C. elegans (C), D. melanogaster (D), and human (H).
Figure 6.
Figure 6.
Trinucleotide distribution in 10-kb tri-SOM for six eukaryotes. Levels of each trinucleotide for all lattice vectors in the tri-SOM of Fig. 4B were divided into five categories and shown as described in Fig. 3F. Species borders are shown as described in Fig. 5. (A) Human. Six diagnostic trinucleotides with high frequencies and four with low frequencies. (B) D. melanogaster. Two diagnostic trinucleotides with high frequencies and four with low frequencies. (C) A. thaliana. Four diagnostic trinucleotides with high frequencies and four with low frequencies (CNG).
Figure 7.
Figure 7.
Di-SOM for 1-kb sequences of six eukaryotes. (A) Di-SOM. Lattices are colored as described in Fig. 4A. (B) CG dinucleotide levels for all weight vectors were calculated and shown as described in Fig. 5. The CG-rich zone in the human territories is noted with an arrow. (C) Three-dimensional presentation of the di-SOM. Number of sequences classified into each lattice that has sequences from a single species is presented with the height of the colored rod.

Similar articles

Cited by

References

    1. Abe T., Kanaya, S., Kinouchi, M., Kudo, Y., Mori, H., Matsuda, H., Carlos, D.C., and Ikemura, T. 1999. Gene classification method based on batch-learning SOM. Genome Inform. Ser. 10: 314-315.
    1. Andersson S.G. and Sharp, P.M. 1996. Codon usage in the Mycobacterium tuberculosis complex. Microbiology 142: 915-925. - PubMed
    1. Bernardi G. 1989. The isochore organization of the human genome. Annu. Rev. Genet. 23: 637-661. - PubMed
    1. Bernardi G., Olofsson, B., Filipski, J., Zerial, M., Salinas, J., Cuny, G., Meunier-Rotival, M., and Rodier, F. 1985. The mosaic genome of warm-blooded vertebrates. Science 228: 953-958. - PubMed
    1. Deng W., Burland, V., Plunkett, G., III, Boutin, A., Mayhew, G.F., Liss, P., Perna, N.T., Rose, D.J., Mau, B., Zhous, S., et al. 2002. Genome sequence of Yersinia pestis KIM. J. Bacteriol. 184: 4601-4611. - PMC - PubMed

Publication types

MeSH terms

Substances

LinkOut - more resources