. 2003 Apr 15;100(8):4395-8.
doi: 10.1073/pnas.0831077100. Epub 2003 Apr 1.

Microfluidics without microfabrication

Affiliations

Microfluidics without microfabrication

Barry R Lutz et al. Proc Natl Acad Sci U S A. .

Abstract

Microfluidic devices create spatially defined, chemically controlled environments at microscopic dimensions. We demonstrate the formation and control of microscopic hydrodynamic and chemical environments by impinging a low-intensity acoustic oscillation on a cylindrical electrode. The interaction of small-amplitude (< or =203 microm), low-frequency (< or =515 Hz) fluid oscillations with a submillimeter cylinder creates four microscopic eddies that circulate adjacent to the cylinder. This steady flow is known as acoustic streaming. Because the steady circulation in the eddies has closed streamlines, reagent dosed from the electrode can escape the eddies only by slow molecular diffusion. As a result, reagent dosing rates of 10 nmol/s produce eddy concentrations as high as 8 mM, without a correspondingly large rise in bulk solution composition. Imaging Raman spectroscopy is used to visualize the eddy concentration distribution for various acoustic oscillation conditions, and point Raman spectra are used to quantify eddy compositions. These results, and corresponding numerical simulations, show that each eddy acts as a microchemical trap with size determined by acoustic frequency and the concentration tuned via reagent dosing rate and acoustic amplitude. Low-intensity acoustic streaming flows can serve as microfluidic elements without the need for microfabrication.


Figures

Figure 1
Figure 1
Experimental system for flow generation. (Left) A horizontal gold cylindrical electrode (A) was suspended from a micropositioning stage by electrically insulated vertical uprights. An acrylic optical cuvette (B) filled with electrolyte was mounted to the coil of an audio speaker (C), and the cuvette and fluid were oscillated about the stationary cylinder. (Right) An I-shaped slot in the cuvette top limited the fluid free surface while allowing insertion and positioning of the cylinder. A baffle (D) partially isolated the lower compartment from free surface flow disturbances.
Figure 2
Figure 2
Cross-section particle path images of steady acoustic streaming near a cylindrical electrode for vertical oscillations. Three different dimensionless acoustic oscillation frequencies are shown (M2 = 100, 200, and 500). An illumination shadow does not allow imaging of the symmetric flow behind the electrode. The electrode surface is revealed by a semicircular arc of very bright scattering in each cross-sectional image. The dashed curves indicate fluidic interfaces that separate electrode eddies from bulk fluid, whereas the straight dashed lines denote flow symmetry. Arrows denote the direction of fluid motion.
Figure 3
Figure 3
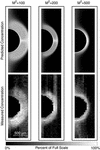
Frequency dependence of predicted (Upper) and measured (Lower) reagent concentrations for mass-transfer-limited dosing from a cylindrical electrode. Experimental concentration images were acquired by using imaging Raman spectroscopy in 25 mM ferricyanide and ferrocyanide solution supported with 1 M NaOH. An illumination shadow does not allow imaging behind the electrode. The gray scale is defined in the text.
Figure 4
Figure 4
Experimental control of eddy concentration using reagent dosing rate and acoustic oscillation amplitude at fixed frequency (M2 = 100). Ferricyanide concentration differences between the electrode eddy and bulk solution ([Fe+3]Eddy − [Fe+3]Bulk) were measured with Raman spectroscopy during galvanostatic dosing in 50 mM ferricyanide and ferrocyanide solutions supported by 1 M NaOH. Error bars represent one standard deviation for three replicate concentration measurements within the eddy.

References

    1. Beebe D J, Mensing G A, Walker G M. Annu Rev Biomed Eng. 2002;4:261–286. - PubMed
    1. Stone H A, Kim S. AIChE J. 2001;47:1250–1254.
    1. Brody J P, Yager P, Goldstein R E, Austin R H. Biophys J. 1996;71:3430–3441. - PMC - PubMed
    1. Weigl B H, Yager P. Science. 1999;283:346–347.
    1. Kamholz A E, Weigl B H, Finlayson B A, Yager P. Anal Chem. 1999;71:5340–5347. - PubMed