. 2003 Apr;15(4):809-34.
doi: 10.1105/tpc.009308.

Genome-wide analysis of NBS-LRR-encoding genes in Arabidopsis

Affiliations

Genome-wide analysis of NBS-LRR-encoding genes in Arabidopsis

Blake C Meyers et al. Plant Cell. 2003 Apr.

Erratum in

  • Plant Cell. 2003 Jul;15(7):1683

Abstract

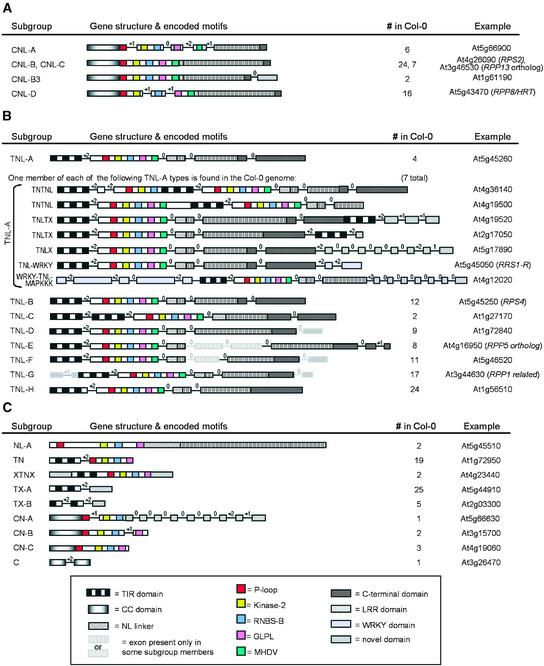
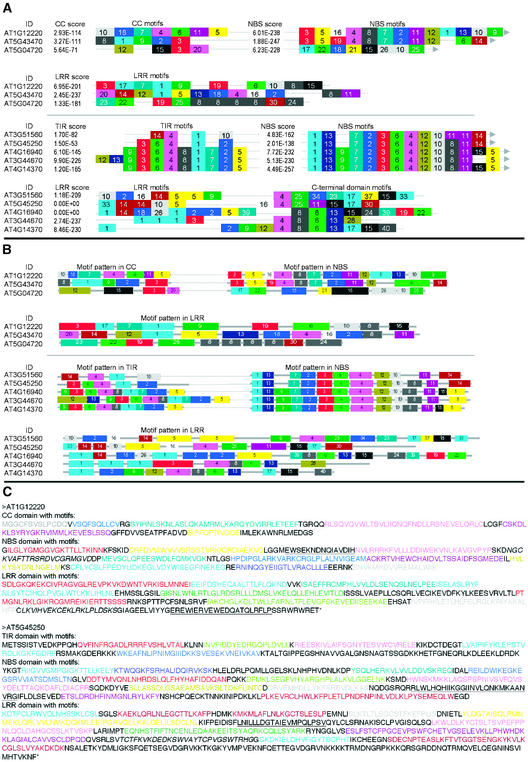
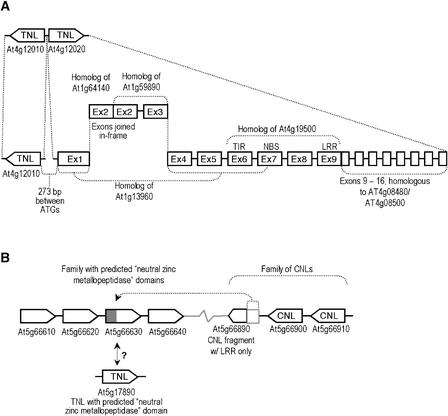
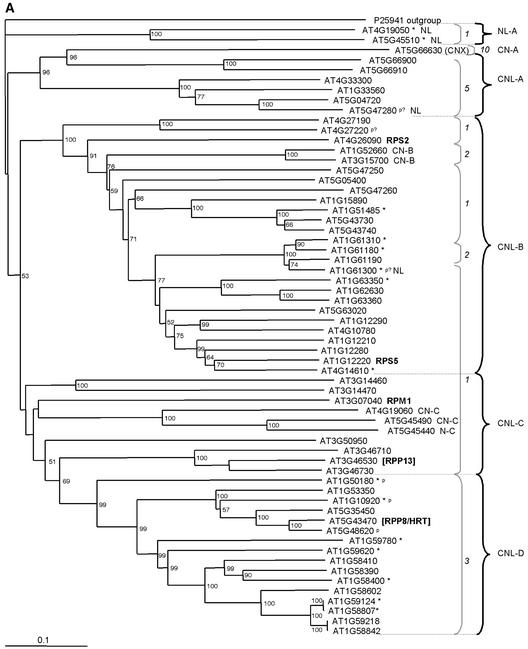
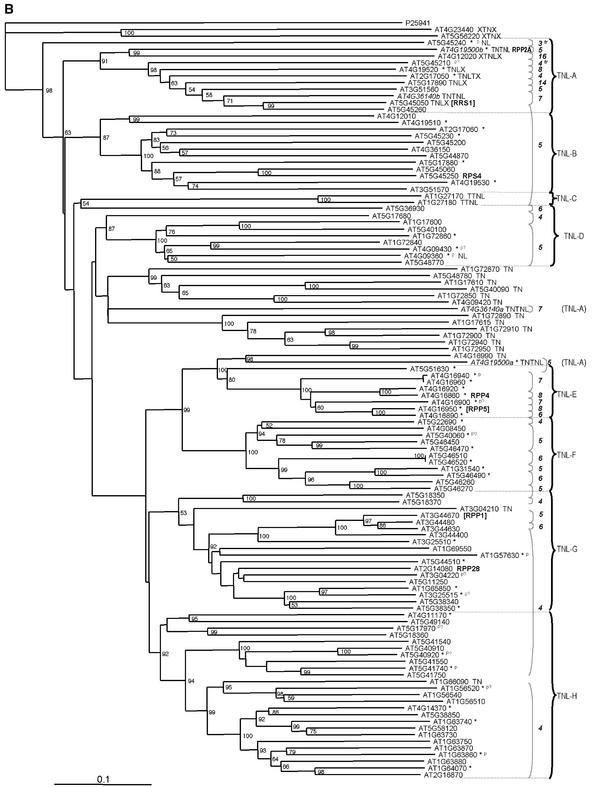
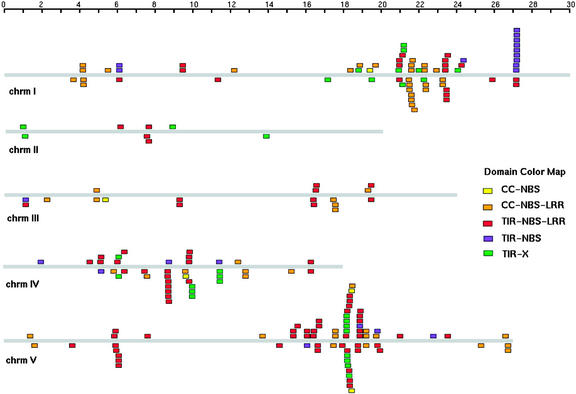
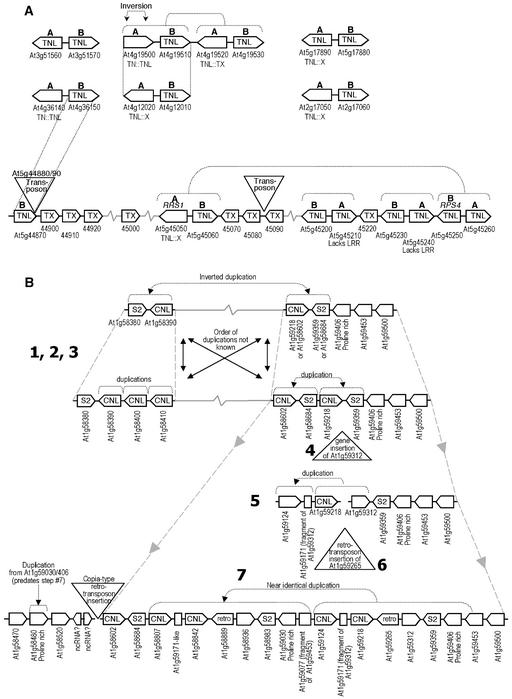
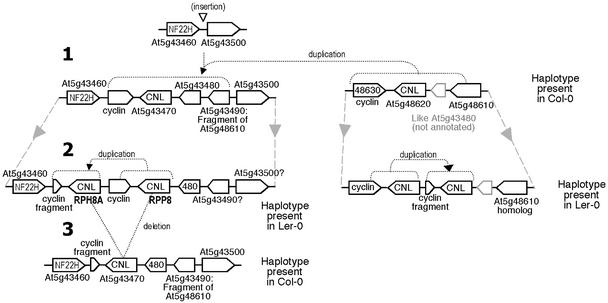
The Arabidopsis genome contains approximately 200 genes that encode proteins with similarity to the nucleotide binding site and other domains characteristic of plant resistance proteins. Through a reiterative process of sequence analysis and reannotation, we identified 149 NBS-LRR-encoding genes in the Arabidopsis (ecotype Columbia) genomic sequence. Fifty-six of these genes were corrected from earlier annotations. At least 12 are predicted to be pseudogenes. As described previously, two distinct groups of sequences were identified: those that encoded an N-terminal domain with Toll/Interleukin-1 Receptor homology (TIR-NBS-LRR, or TNL), and those that encoded an N-terminal coiled-coil motif (CC-NBS-LRR, or CNL). The encoded proteins are distinct from the 58 predicted adapter proteins in the previously described TIR-X, TIR-NBS, and CC-NBS groups. Classification based on protein domains, intron positions, sequence conservation, and genome distribution defined four subgroups of CNL proteins, eight subgroups of TNL proteins, and a pair of divergent NL proteins that lack a defined N-terminal motif. CNL proteins generally were encoded in single exons, although two subclasses were identified that contained introns in unique positions. TNL proteins were encoded in modular exons, with conserved intron positions separating distinct protein domains. Conserved motifs were identified in the LRRs of both CNL and TNL proteins. In contrast to CNL proteins, TNL proteins contained large and variable C-terminal domains. The extant distribution and diversity of the NBS-LRR sequences has been generated by extensive duplication and ectopic rearrangements that involved segmental duplications as well as microscale events. The observed diversity of these NBS-LRR proteins indicates the variety of recognition molecules available in an individual genotype to detect diverse biotic challenges.


Figures

Figure 1.
Figure 1.
Intron/Exon Configurations and Protein Motifs of NBS-LRR–Encoding Genes in Arabidopsis. (A) CNL genes. (B) TNL genes. All members of the variable TNL-A subgroup are shown; only one member of the more homogeneous subgroups is diagrammed. (C) Additional genes that encode CC, TIR, or NBS domains similar to the CNL or TNL proteins. TN and TX genes are described in more detail by Meyers et al. (2002). Encoded protein domains are indicated with shading and colors. Exons are drawn approximately to scale as boxes; connecting thin lines indicate the positions of introns, which are not drawn to scale. Numbers above introns indicate the phase of the intron (see text). Numbers under “# in Col-0” indicate the total number found in the Col-0 genomic sequence; the “representative” columns list the diagrammed gene for each type. Genes of known function are shown where available.
Figure 2.
Figure 2.
Motif Patterns in CNL and TNL Proteins. Different colored boxes and numbers indicate separate and distinct motifs identified using MEME (Bailey and Elkan, 1995) and displayed by MAST (Bailey and Gribskov, 1998). Motifs are colored the same in (A), (B), and (C). ID, identifier number. (A) Examples of summarized and aligned MEME motifs for different domains of CNL and TNL proteins. All proteins are displayed in the supplemental data online. Thin dotted lines indicate their linear order. Motifs from the MEME analyses in supplemental data online (MEME outputs 1 to 6) were consolidated and aligned manually in a spreadsheet. To allow alignment, the size of the colored and numbered box does not correspond to the size of the motif. Because motif analyses had to be performed for each domain separately for each of the CNL and TNL groups of proteins, numbers and colors are specific only to that domain. The MEME “score” for the overall match of the protein to the motif models is given as a P value. Missing motifs may indicate either a poor match (>e−04) or a deleted domain. (B) Examples of MEME output of the same proteins summarized in (A). Data for all proteins are available in the supplemental data online (MEME outputs 1 to 6). The sizes of the boxes and the gaps between motifs are drawn according to scale to illustrate the relative sizes and positions of each domain and motif that is not displayed in (A). (C) Two examples of the motifs found in individual CNL and TNL protein sequences that are displayed in (A) and (B). Colors were added manually to illustrate the motifs identified by MEME and displayed by MAST. MEME motif alignments with the sequences are available in the output of the MAST program in the supplemental data online (MAST outputs 1 to 6).
Figure 3.
Figure 3.
Modifications of Two TNL Proteins Caused by Genic Rearrangements. (A) Gene At4g12020 encodes protein domains similar to five different genes. Exons (Ex) 2 and 9 encode in-frame fusions of distinct protein domains. Based on sequence homologies, exons 2 and 3 apparently were inserted into exons 1, 4, and 5. Exons 6 to 9 encode TNL domains fused at the 3′ end to a mitogen-activated protein kinase kinase kinase homolog. The complete gene was found in a head-to-head orientation with TNL At4g12010; 273 bp separates the predicted translational start codons of these genes. (B) Gene At5g66630 encodes an NBS fused to neutral zinc metallopeptidase motifs; the NBS of this gene is related most closely to a nearby family of CNL genes, one of which is lacking the NBS region, suggesting a translocation of this domain. At5g17890 is a TNL fused to neutral zinc metallopeptidase motifs homologous with At5g66630 (BLAST E value = 3e−82).
Figure 4.
Figure 4.
Phylogenetic Relationship of NBS-Containing Predicted Proteins from the Complete Arabidopsis Genome. (A) Tree of CN and CNL proteins. (B) Tree of TN and TNL proteins. Neighbor-joining trees from distance matrices constructed according to the two-parameter method of Kimura (1980) using the aligned NBS protein sequences. Branch lengths are proportional to genetic distance. Sequence identifiers are given for each sequence as designated by the Arabidopsis Genome Initiative (2000). Names of known resistance gene products are indicated in boldface. The number of exons for each gene is indicated at right by gray brackets. Asterisks indicate that our gene prediction differed from that in MIPS and TIGR; superscript “p” indicates a predicted or potential pseudogene (see text). The Streptomyces sequence rooted both trees as the outgroup. Numbers on branches indicate the percentage of 1000 bootstrap replicates that support the adjacent node; bootstrap results were not reported if the support was <50%. Black braces at right in each tree indicate the subgroup names; subgroups were defined based on phylogeny and intron position/number (see text). Proteins that contained either more or less than the CC-NBS-LRR domains (in [A]) or the TIR-NBS-LRR domains (in [B]) are indicated with a code after the identifier that refers to protein configurations in Table 1. Two sequences each had two NBS domains; these domains were included in the analysis with the primary subgroup (TNL-A) indicated in parentheses by the position of the second NBS. The trees are available at http://niblrrs.ucdavis.edu with links to data for each gene.
Figure 4.
Figure 4.
Phylogenetic Relationship of NBS-Containing Predicted Proteins from the Complete Arabidopsis Genome. (A) Tree of CN and CNL proteins. (B) Tree of TN and TNL proteins. Neighbor-joining trees from distance matrices constructed according to the two-parameter method of Kimura (1980) using the aligned NBS protein sequences. Branch lengths are proportional to genetic distance. Sequence identifiers are given for each sequence as designated by the Arabidopsis Genome Initiative (2000). Names of known resistance gene products are indicated in boldface. The number of exons for each gene is indicated at right by gray brackets. Asterisks indicate that our gene prediction differed from that in MIPS and TIGR; superscript “p” indicates a predicted or potential pseudogene (see text). The Streptomyces sequence rooted both trees as the outgroup. Numbers on branches indicate the percentage of 1000 bootstrap replicates that support the adjacent node; bootstrap results were not reported if the support was <50%. Black braces at right in each tree indicate the subgroup names; subgroups were defined based on phylogeny and intron position/number (see text). Proteins that contained either more or less than the CC-NBS-LRR domains (in [A]) or the TIR-NBS-LRR domains (in [B]) are indicated with a code after the identifier that refers to protein configurations in Table 1. Two sequences each had two NBS domains; these domains were included in the analysis with the primary subgroup (TNL-A) indicated in parentheses by the position of the second NBS. The trees are available at http://niblrrs.ucdavis.edu with links to data for each gene.
Figure 5.
Figure 5.
Physical Locations of Arabidopsis Sequences That Encode NBS Proteins Similar to Plant R Genes. Boxes above and below each Arabidopsis chromosome (chrm; gray bars) designate the approximate locations of each gene. Chromosome lengths are shown in megabase pairs on the scale at top. A list of the clusters is given in the supplemental data online. Similar figures are available at http://niblrrs.ucdavis.edu with links to data for each gene.
Figure 6.
Figure 6.
Multiple Localized Duplication Events That Resulted in Clusters of NBS-LRR–Encoding Genes. Dotted lines designate the boundaries of duplication events inferred from closely related sequences. Triangles indicate the insertion site of a gene, transposon, or retrotransposon. (A) An ancient pairing of genes that is present in ∼11 occurrences in the Col-0 genomic sequence. Genes labeled A belong to the monophyletic subgroup TNL-A, and genes labeled B belong to the monophyletic subgroup TNL-B. See Figure 4 for more detailed phylogenetic relationships. B genes encode predicted TNLs, whereas A genes encode modified TNLs with additional protein motifs, as indicated below the gene identifier. (B) A complex family of CNLs and unrelated genes on chromosome I. The evolutionary history of the cluster was inferred based on observed sequence homologies in the Col-0 genomic sequence. Boldface numerals indicate the order of events predicted in this region, as inferred from relationships of pairs of genes and gene fragments. Dashed lines that connect the ends of the clusters indicate the boundaries of a single region shown at different inferred evolutionary time points. The scheme at bottom represents the extant Col-0 sequence. The black arrows indicate that evidence of multiple duplication events was identified, but the order of these events could not be distinguished. ncRNA, noncoding RNA identified in the gene annotation.
Figure 7.
Figure 7.
Rearrangements among RPP8 Homologs in Arabidopsis Ecotypes. Two clusters were analyzed in Col-0 and Ler to determine the genetic rearrangements in their evolutionary history. The inferred ancient arrangement of the cluster and the earliest events are indicated at top. Below, later events and the extant genomic arrangement in Col-0 and Ler are shown. Dotted lines designate the boundaries of duplication events inferred from closely related sequences. Dashed lines that connect the ends of the clusters indicate the boundaries of a single region shown at different inferred evolutionary time points. Sequences for the Ler RPP8 cluster were obtained from GenBank (McDowell et al., 1998).

Comment in

References

    1. Aarts, M.G., te Lintel Hekkert, B., Holub, E.B., Beynon, J.L., Stiekema, W.J., and Pereira, A. (1998). Identification of R gene homologous DNA fragments genetically linked to disease resistance loci in Arabidopsis thaliana. Mol. Plant-Microbe Interact. 11, 251–258. - PubMed
    1. Altschul, S.F., Madden, T.L., Schaffer, A.A., Zhang, J., Zhang, Z., Miller, W., and Lipman, D.J. (1997). Gapped BLAST and PSI-BLAST: A new generation of protein database search programs. Nucleic Acids Res. 25, 3389–3402. - PMC - PubMed
    1. Anderson, P.A., Lawrence, G.J., Morrish, B.C., Ayliffe, M.A., Finnegan, E.J., and Ellis, J.G. (1997). Inactivation of the flax rust resistance gene M associated with loss of a repeated unit within the leucine-rich repeat coding region. Plant Cell 9, 641–651. - PMC - PubMed
    1. Arabidopsis Genome Initiative (2000). Analysis of the genome sequence of the flowering plant Arabidopsis thaliana. Nature 408, 796–815. - PubMed
    1. Aravind, L., Dixit, V.M., and Koonin, E.V. (1999). The domains of death: Evolution of the apoptosis machinery. Trends Biochem. Sci. 24, 47–53. - PubMed

Publication types

MeSH terms