. 2003 Apr;15(4):939-51.
doi: 10.1105/tpc.010538.

Leaf vitamin C contents modulate plant defense transcripts and regulate genes that control development through hormone signaling

Affiliations

Leaf vitamin C contents modulate plant defense transcripts and regulate genes that control development through hormone signaling

Gabriela M Pastori et al. Plant Cell. 2003 Apr.

Abstract

Vitamin C deficiency in the Arabidopsis mutant vtc1 causes slow growth and late flowering. This is not attributable to changes in photosynthesis or increased oxidative stress. We have used the vtc1 mutant to provide a molecular signature for vitamin C deficiency in plants. Using statistical analysis, we show that 171 genes are expressed differentially in vtc1 compared with the wild type. Many defense genes are activated, particularly those that encode pathogenesis-related proteins. Furthermore, transcript changes indicate that growth and development are constrained in vtc1 by the modulation of abscisic acid signaling. Abscisic acid contents are significantly higher in vtc1 than in the wild type. Key features of the molecular signature of ascorbate deficiency can be reversed by incubating vtc1 leaf discs in ascorbate. This finding provides evidence that many of the observed effects on transcript abundance in vtc1 result from ascorbate deficiency. Hence, through modifying gene expression, vitamin C contents not only act to regulate defense and survival but also act via phytohormones to modulate plant growth under optimal conditions.


Figures

Figure 1.
Figure 1.
Strategy for Microarray Analysis of Gene Expression in the Vitamin C–Deficient vtc1 Arabidopsis Mutant.
Figure 2.
Figure 2.
Scatterplot of the 171 Transcripts That Show Consistent Differential Abundance in Col0 and vtc1. The Col0 and vtc1 arrays were normalized against the expression levels of the array with the median overall intensity (sample Col0A had a median overall intensity of 1017). The model-based expression levels were calculated with the dChip package according to Li and Wong (2001). Col0 then was compared with vtc1, selecting expressed/baseline > 1.2 and baseline/expressed > 1.2, taking the lower 90% confidence boundary of fold change. Additionally, expression levels showing a difference from the baseline of ≤100 (10% of median) were rejected. The scatterplot illustrates the normalized intensities for the genes selected with the criteria described above. The y axis shows expressed minus baseline intensities, with values above the x axis indicating genes with greater intensity in vtc1 and values below the line indicating genes with less intensity in vtc1. The gene number is arbitrary, according to the Affymetrix spot list. It is not intended to be related to the gene order in the supplemental data online but to give a precise indication of differences in expression levels.
Figure 3.
Figure 3.
Part of the Hierarchical Clustering of the Transcripts That Showed Significant Changes in Abundance between vtc1 and the Wild Type (Col0). Using the dChip package, the following criteria were selected to show a representative clustering of the data. Data were normalized as for the scatterplot (Figure 2), but the difference between expression level and baseline was increased to 200 (20% of median levels) to illustrate the more strongly exhibited features. Outliers as determined by Li and Wong (2001) were treated as missing data (these show as black on the cluster diagram). Further filtering was applied to the data. The variation across sample was restricted by setting 0.5 < standard deviation/mean < 2. Spots exhibiting >50% probability were included. The expression level was >500 in all samples. Degrees of red and blue indicate the extent of positive and negative fold change, respectively. Hierarchical clustering is considered by many as a means of visualization. For simplicity, the relative changes between Col0A and vtc1A, et cetera, could be compared. The tree branches represent a hierarchical organization of expression levels. It should be noted that the clustering is a statistical tool, and it is doubtful if it has any biological significance. It essentially shows similar expression levels and groups these clumps of expression levels together. For reasons of space, the clustering shows a restricted number (approximately half) of the 171 transcripts of interest.
Figure 4.
Figure 4.
Low Vitamin C Modifies Gene Expression in Arabidopsis. Microarray analysis was used to compare leaf transcript abundance in the vitamin C–deficient Arabidopsis mutant vtc1 and the corresponding wild type, Col0. A total of 171 transcripts were significantly and reproducibly modified in abundance and assigned to functional categories. The chart shows the distribution between functional classes of transcripts that differ in abundance in vtc1 and the wild type. Numbers indicate percentages of total transcripts for which significant differences in abundance were observed. For further details, see the supplemental data online.
Figure 5.
Figure 5.
Validation of Results from the Microarray Analysis. The transcript abundance of a selected range of genes whose expression was altered significantly in the microarray experiment was analyzed by reverse transcriptase–mediated PCR. The analysis was performed using primers specific to the following genes: WRKY binding protein (WRKY; At4g923180), ascorbate oxidase (AO[FeII]; At4g10500), cyclin-dependent kinase (ICK1; At2g23430), 9-cis-epoxicarotenoid dioxygenase (NCED; At4g19170), pathogenesis-related protein1 (PR1; At2g14610), receptor-like kinase a (RLKa; At4g23260), receptor-like kinase b (RLKb; At4g23150), receptor-like kinase c (RLKc; At5g35370), receptor-like kinase d (RLKd; At4g04500), and p34 cyclin-dependent kinase 2a (p34cdc2a; X57839).
Figure 6.
Figure 6.
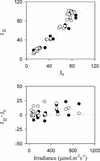
Relationship between Total Photosynthetic Electron Flux (JII) and Flux Linked to Ribulose-1,5-Bisphosphate Carboxylation and Oxygenation (Je) in Attached Leaves of Arabidopsis Illuminated at Different Irradiances in Air. Open circles, wild type (Col0); closed circles, vtc1.
Figure 7.
Figure 7.
Induction of Genes Involved in Pathogen Resistance in vtc1. Three PAL sequences were present on the microarray chip, PAL1 (accession number X84728), PAL2 (At3g53260), and PAL3 (At5g04230); as well as pathogenesis-related proteins 1 (PR1; At2g14610), 2 (PR2; At3g57260), and 5 (PR5; At1g75040); a putative disease resistance protein (DRP; At4g13900); β-glucanase (At4g16260); and chitinase (At2g43570). Col0 and vtc1 plants were grown for 6 weeks in pots containing a mixture of compost:sand (3:1) in controlled-environment chambers (8-h photoperiod, 200 μmol·m−2·s−1 irradiance, 60% [v/v] RH, and day/night temperatures of 23 and 18°C). Fully developed leaves were collected at random from rosettes and pooled for RNA extraction and mRNA purification by prescribed methods (http://afgc.stanford.edu/afgc-array-rna.html).
Figure 8.
Figure 8.
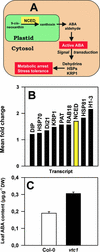
ABA Synthesis and Signaling Is Upregulated in the Vitamin C–Deficient Arabidopsis Mutant vtc1. (A) Scheme showing the synthesis of ABA via chloroplastic NCED followed by the signaled shutdown of metabolism and cell division, accompanied by enhanced hardiness. Dehydrins, dehydration-induced proteins; HSPs, heat-shock proteins; KRP1, cyclin-dependent kinase inhibitor. (B) Observed induction in vtc1 of NCED transcripts (At4g19170; yellow bar) and transcripts responsive to ABA or to drought (black bars). DIP, putative drought-induced protein (At4g02200); HSP70, heat-shock protein70 (At3g12580); Di21, dehydrin 21 (At4g15910); KRP1, kinesin inhibitor protein–related protein; ICK1, a cyclin-dependent kinase inhibitor (At2g23430); PAT, phosphoribosyl anthranilate transferase (At4g00700); RAB18, responsive to abscisic acid protein 18 (At5g66400); HSP81, heat-shock protein81; H1-3, histone H1-3 (At2g18050). (C) Increases in leaf ABA content in vtc1. Data are means ± se of nine independent analyses. DW, dry weight.
Figure 9.
Figure 9.
Reversion of Gene Expression in vtc1 by Ascorbate Feeding. Transcript abundance of a selected range of genes whose expression was reversed by ascorbate feeding in the Stanford microarray experiment. PR1, pathogenesis-related protein1; HAT5, homeobox Leu zipper transcription factor HAT5; BEL1, homeobox Leu zipper transcription factor BEL1; VPE1, vacuolar processing enzyme1; ASP, aspartyl protease. Values indicate positive and negative fold changes in vtc1 and vtc1 incubated in 10 mM ascorbate, respectively.

References

    1. Agrawal, G.K., Rakwal, R., Jwa, N.S., and Agrawal, V.P. (2001). Signaling molecules and blast pathogen attack activates rice OsPR1a and OsPR1b genes: A model illustrating components participating during defence/stress response. Plant Physiol. Biochem. 39, 1095–1103.
    1. Arrigoni, O., and de Tullio, M.C. (2000). The role of ascorbic acid in cell metabolism: Between gene-directed functions and unpredictable chemical reactions. J. Plant Physiol. 157, 481–488.
    1. Ascenzi, R., and Gantt, S. (1997). A drought-stress inducible histone gene in Arabidopsis thaliana is a member of a distinct class of plant linker histone variants. Plant Mol. Biol. 34, 629–641. - PubMed
    1. Bianco, J., and Dalstein, L. (1999). Abscisic acid in needles of Pinus cembra in relation to ozone exposure. Tree Physiol. 19, 787–791. - PubMed
    1. Blázquez, M.A., Green, R., Nilsson, O., Sussman, M.R., and Weigel, D. (1998). Gibberellins promote flowering of Arabidopsis by activating the LEAFY promoter. Plant Cell 10, 791–800. - PMC - PubMed

Publication types

MeSH terms