. 2003 Apr;15(4):952-64.
doi: 10.1105/tpc.010108.

Suppression of sucrose synthase gene expression represses cotton fiber cell initiation, elongation, and seed development

Affiliations

Suppression of sucrose synthase gene expression represses cotton fiber cell initiation, elongation, and seed development

Yong-Ling Ruan et al. Plant Cell. 2003 Apr.

Abstract

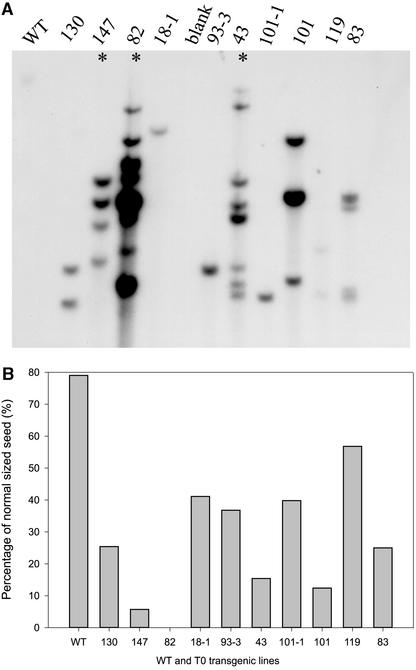
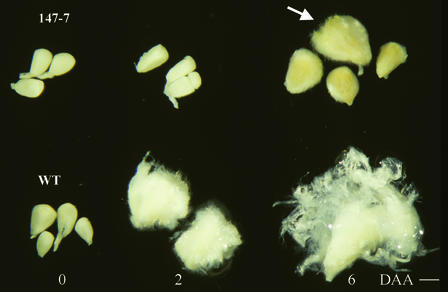
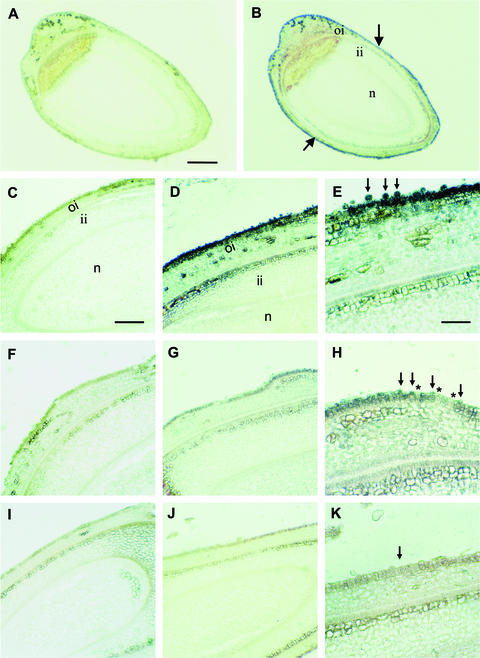
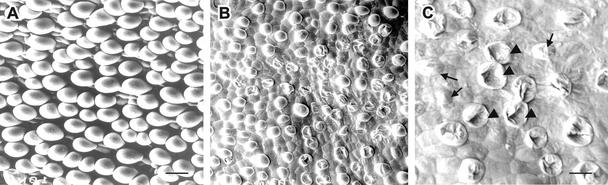
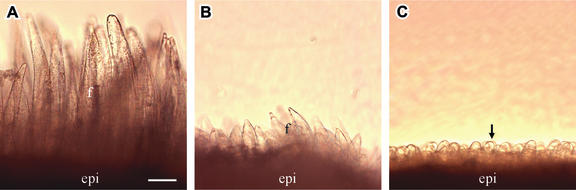
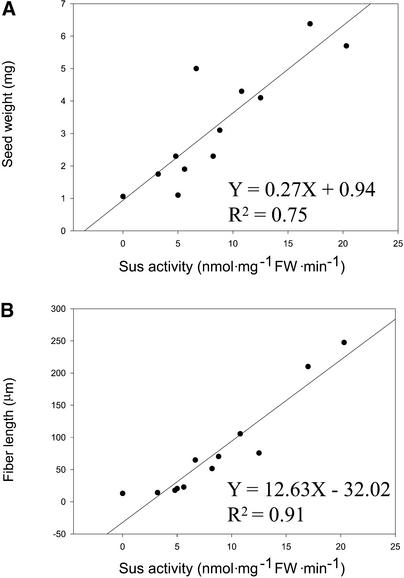
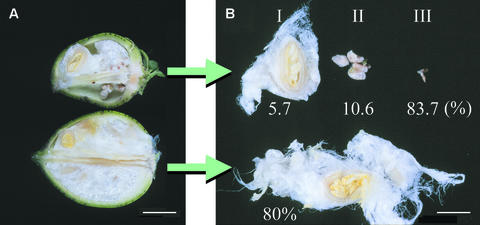
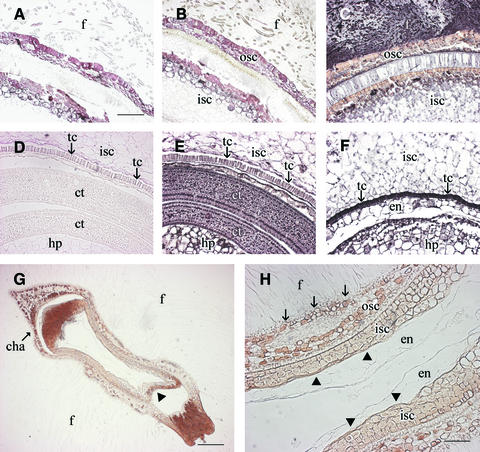
Cotton is the most important textile crop as a result of its long cellulose-enriched mature fibers. These single-celled hairs initiate at anthesis from the ovule epidermis. To date, genes proven to be critical for fiber development have not been identified. Here, we examined the role of the sucrose synthase gene (Sus) in cotton fiber and seed by transforming cotton with Sus suppression constructs. We focused our analysis on 0 to 3 days after anthesis (DAA) for early fiber development and 25 DAA, when the fiber and seed are maximal in size. Suppression of Sus activity by 70% or more in the ovule epidermis led to a fiberless phenotype. The fiber initials in those ovules were fewer and shrunken or collapsed. The level of Sus suppression correlated strongly with the degree of inhibition of fiber initiation and elongation, probably as a result of the reduction of hexoses. By 25 DAA, a portion of the seeds in the fruit showed Sus suppression only in the seed coat fibers and transfer cells but not in the endosperm and embryo. These transgenic seeds were identical to wild-type seeds except for much reduced fiber growth. However, the remaining seeds in the fruit showed Sus suppression both in the seed coat and in the endosperm and embryo. These seeds were shrunken with loss of the transfer cells and were <5% of wild-type seed weight. These results demonstrate that Sus plays a rate-limiting role in the initiation and elongation of the single-celled fibers. These analyses also show that suppression of Sus only in the maternal seed tissue represses fiber development without affecting embryo development and seed size. Additional suppression in the endosperm and embryo inhibits their own development, which blocks the formation of adjacent seed coat transfer cells and arrests seed development entirely.


Figures

Figure 1.
Figure 1.
Transgene Copy Number and Percentage of Normal-Sized Cotton Seeds. (A) Gel blot analysis of DNA isolated from 10 primary (T0) transformants and wild-type (WT) plants digested with EcoRI and probed with a 1-kb NPTII probe (see Methods). The transformant numbers are shown. Asterisks indicate lines that showed an obvious fiberless seed phenotype at 0 to 6 DAA. (B) Percentage of normal-sized T1 seeds in mature cotton fruit from the T0 lines shown in (A). The remaining T1 seeds were stunted and inviable. Each value is the mean of ∼350 seeds from 10 mature fruit with se < 10%.
Figure 2.
Figure 2.
Fiberless Seed Phenotype of Sus-Suppressed T1 Line 147-7 Compared with Wild-Type Seeds at 0, 2, and 6 DAA. Note that a small portion of transgenic seeds showed a layer of very short fibers with wild-type (WT) seed size at 6 DAA (arrow). Bar = 0.1 cm.
Figure 3.
Figure 3.
Immunogold Localization of Sus Protein in Wild-Type and Transgenic Ovules at 0 DAA. (A) Whole view of a longitudinal section of a wild-type ovule treated with preimmune serum. (B) A consecutive section of (A) treated with polyclonal antibody against cotton Sus. Note that the Sus protein signal was detected specifically in the ovule epidermis (arrows) but not in the remaining ovule tissues. (C) A wild-type longitudinal section treated with preimmune serum. (D) A consecutive section of (C) treated with the Sus antibody showing strong Sus signal in the ovule epidermis and expanding fiber initials. (E) Magnified view of the epidermis in (D) showing abundant Sus proteins in spherically expanding fiber initials (arrows). (F) A longitudinal section of ovules from line 147-7 treated with preimmune serum. (G) A consecutive section of (F) treated with the Sus antibody. Note the very weak Sus signal in the ovule epidermis compared with the wild type in (D). (H) Magnified view of the epidermis in (G). Note, in comparison with the wild-type ovules (E), that the fiber initials were much smaller and fewer and showed dramatically reduced levels of Sus (arrows). Also note that the detectable Sus signal was restricted to the small fiber initials (arrows) and was not seen in the adjacent epidermal cells (asterisks). (I) A longitudinal section of ovules from line 82 treated with preimmune serum. (J) A consecutive section of (I) treated with the Sus antibody. Note that Sus signals were undetectable. (K) Magnified view of the epidermis in (J) showing no Sus protein signals and/or few fiber cells (arrow). The black signal represents Sus proteins. ii, inner integument; n, nucellus; oi, outer integument. Bars = 250 μm in (A), 125 μm in (C), and 65 μm in (E). The scale in (B) is the same as that in (A); the scale in (D), (F), (G), (I), and (J) is the same as that in (C); the scale in (H) and (K) is the same as that in (E).
Figure 4.
Figure 4.
Scanning Electron Microscopy of the Surface of Wild-Type and Transgenic Ovules at 0 DAA. (A) Wild-type ovule epidermis showing evenly arranged and spherically expanding fiber initials. (B) Transgenic ovules from 147-7. Note that the fiber cells are much smaller and fewer. (C) Magnified view of (B) showing the collapsed (arrowheads) and shrunken (arrows) fiber initials. Bars = 15 μm in (A) and 5 μm in (C). The scale in (B) is the same as that in (A).
Figure 5.
Figure 5.
Fiber Length of Wild-Type and Transgenic Cotton Seeds at 3 DAA. (A) Fiber from wild-type seeds. (B) Fiber from transgenic line 147-7. Note the much reduced fiber length compared with (A). (C) Fiber from transgenic line 82 showing that fiber elongation was inhibited completely. Some fiber-like epidermal cells are indicated by the arrow. epi, epidermis; f, fiber. Bar = 55 μm in (A). The scale in (B) and (C) is the same as that in (A).
Figure 6.
Figure 6.
Regression Correlation between the Suppression of Sus Activity in Ovules at 0 DAA and the Reduction of Seed Weight and Fiber Length at 3 DAA among Wild-Type and 11 Sus-Suppressed Transgenic Individuals. Each value is the mean of at least six replicates. FW, fresh weight. (A) Seed weight. (B) Fiber length.
Figure 7.
Figure 7.
Phenotypes of Sus-Suppressed Transgenic Cotton Fruit and Seeds at 25 DAA. (A) Cotton fruit. (B) Cotton seeds. The top and bottom samples represent T1 line 147-7 and the wild type, respectively. The numbers in (B) indicate the percentage of a given seed type among the seed population, derived from 10 fruits in each case. Bars = 2.0 cm in (A) and 0.8 cm in (B).
Figure 8.
Figure 8.
Immunogold Localization of Sus Protein in Type-I and Type-II Seeds of Line 147-7 Compared with Wild-Type Seeds at 25 DAA. (A) Cross-section of a type-I seed from the transgenic line treated with preimmune serum. (B) A consecutive section of (A) treated with polyclonal antibody against cotton Sus. Note that Sus protein signals were much reduced in fibers compared with that of the wild type in (C). (C) Cross-section of a wild-type seed showing strong Sus protein signals in the fibers. (D) The same image in (A) viewed toward the inner side of the section. (E) The same image in (B) viewed toward the inner side of the section showing that the Sus signals were reduced in the seed coat transfer cells but not in the embryos (i.e., cotyledon and hypocotyl) compared with those in the wild-type seed (F). (F) The same image in (C) viewed toward the inner side of the section. Note the strong Sus signals in seed coat transfer cells and embryos. The cotyledons, which showed levels of Sus protein similar to that in (E), are not visible as a result of the different sectioning position of the seed. The residual endosperm also showed Sus protein signals. (G) Longitudinal section of a type-II seed from the transgenic line treated with Sus antibody. Note that Sus protein was undetectable throughout the section and that the seed was deformed, with a gap formed between the outer and inner seed coats at the micropyle (arrowhead) and chalazal ends. (H) Magnified view of the central area in (G). Note the absence of embryo and the presence of some residual abnormal endosperm cells that lacked any labeling of Sus protein. Also note that there was no transfer cell at the innermost layer of the inner seed coat (arrowheads) and that the epidermal cells of the outer seed coat were degenerated (arrows) compared with those of the wild type in (C) and (F). The black signal represents Sus proteins. cha, chalaza; ct, cotyledon; en, endosperm; f, fiber; hp, hypocotyl; isc, inner seed coat; osc, outer seed coat; tc, transfer cell. Bars = 400 μm in (A), 800 μm in (G), and 200 μm in (H). The scale in (B) to (F) is the same as that in (A).
Figure 9.
Figure 9.
Unfertilized Ovules Failed to Form Seed Coat Transfer Cells. (A) Cross-section of a wild-type seed at 12 DAA showing the presence of transfer cells at the innermost layer of the inner seed coat. (B) Unfertilized ovules had a disorganized mass of numerous small cells rather than transfer cells (arrows) by 12 DAA. Also note the residual nucellus and the absence of endosperm tissue. (C) Cross-section of a wild-type seed at 12 DAA viewed by dark-field microscopy showing the wall ingrowth (arrowheads) of the transfer cells toward the cellularized endosperm. (D) Cross-section of an unfertilized ovule viewed by dark-field microscopy showing numerous small cells at the innermost layer of the inner seed coat, which lacked the wall ingrowths characteristic of the transfer cells shown in (C). Also note the presence of the residual nucellus tissue and the absence of endosperm. en, endosperm; isc, inner seed coat; n, nucellus; tc, transfer cell. Bar = 60 μm in (A). The scale in (B) to (D) is the same as that in (A).

References

    1. Amor, Y., Haigler, C.H., Johnson, S., Wainscott, M., and Delmer, D.P. (1995). A membrane-associated form of Sus and its potential role in synthesis of cellulose and callose in plants. Proc. Natl. Acad. Sci. USA 92, 9353–9357. - PMC - PubMed
    1. Basra, A., and Malik, C.P. (1984). Development of the cotton fiber. Int. Rev. Cytol. 89, 65–113.
    1. Buchala, A.J. (1999). Noncellulosic carbohydrates in cotton fibers. In Cotton Fibers: Developmental Biology, Quality Improvement and Textile Processing, A.S. Basra, ed (New York: Food Products Press), pp. 113–136.
    1. Chengappa, S., Guilleroux, M., Phillips, W., and Shields, R. (1999). Transgenic tomato plants with decreased sucrose synthase are unaltered in starch and sugar accumulation in the fruit. Plant Mol. Biol. 40, 213–221. - PubMed
    1. Chourey, P.S., Chen, Y.C., and Miller, M.E. (1991). Early cell degeneration in developing endosperm is unique to the Shrunken mutation in maize. Maydica 36, 141–146.

Publication types

MeSH terms