Comparative Study
. 2003 Apr 15;17(8):991-1008.
doi: 10.1101/gad.1074403. Epub 2003 Apr 2.

The microRNAs of Caenorhabditis elegans

Affiliations
Comparative Study

The microRNAs of Caenorhabditis elegans

Lee P Lim et al. Genes Dev. .

Abstract

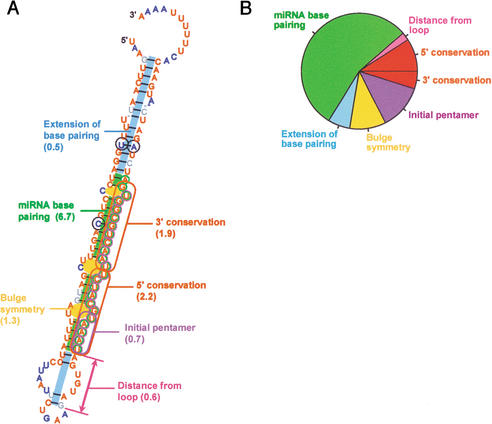
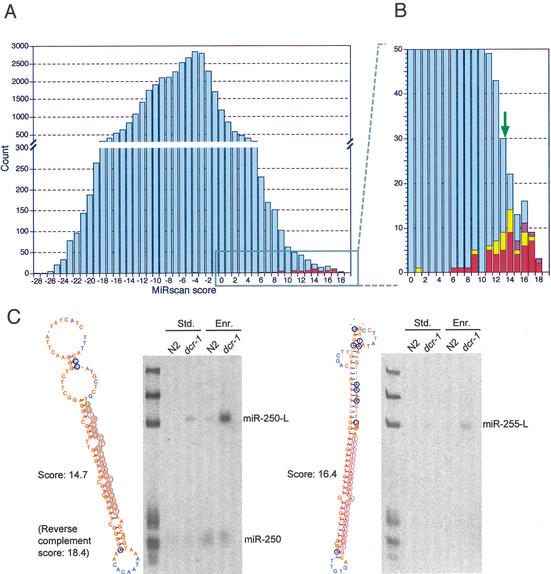
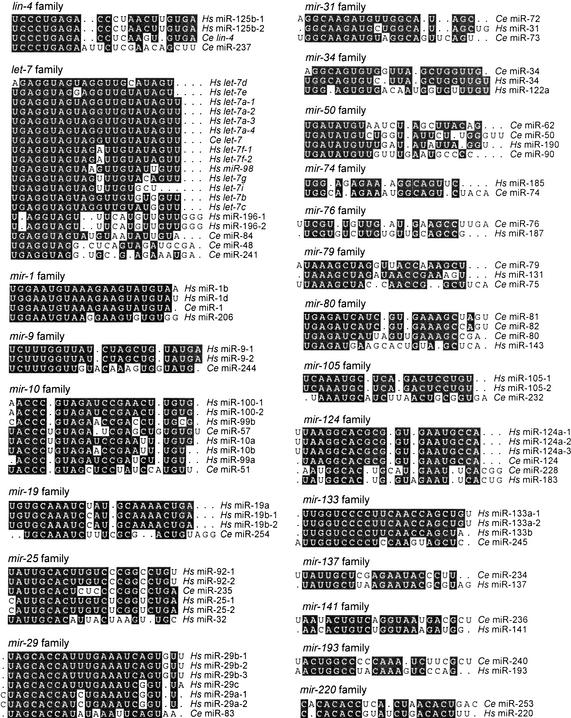
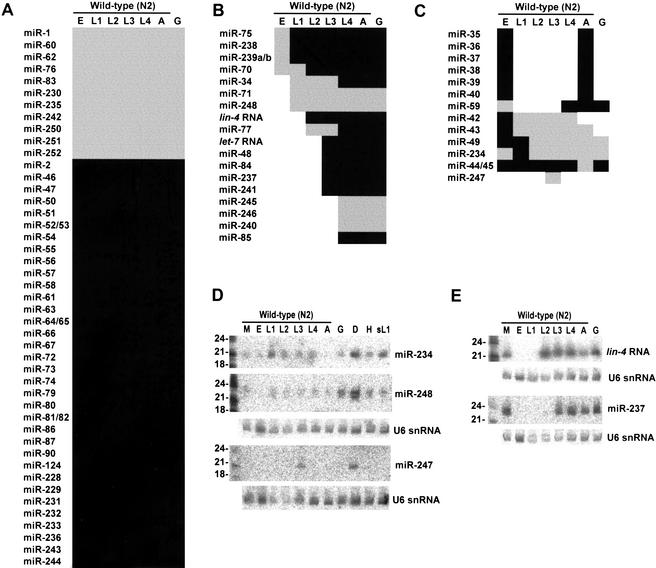
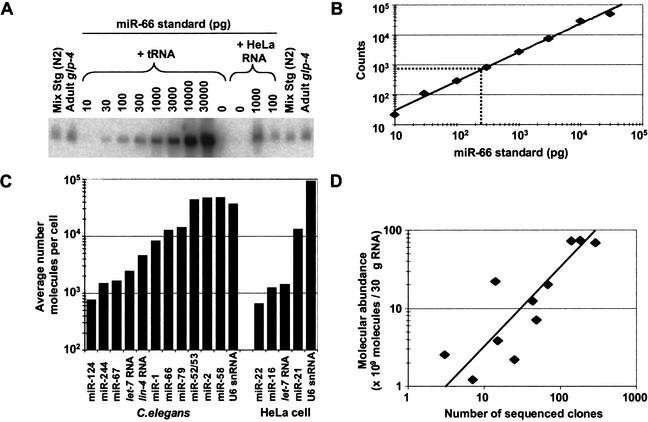
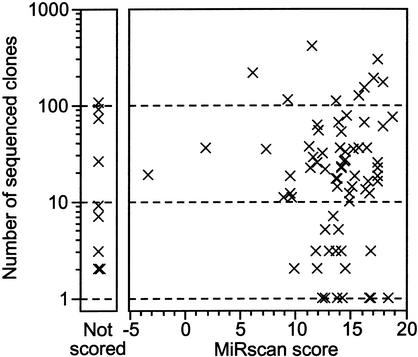
MicroRNAs (miRNAs) are an abundant class of tiny RNAs thought to regulate the expression of protein-coding genes in plants and animals. In the present study, we describe a computational procedure to identify miRNA genes conserved in more than one genome. Applying this program, known as MiRscan, together with molecular identification and validation methods, we have identified most of the miRNA genes in the nematode Caenorhabditis elegans. The total number of validated miRNA genes stands at 88, with no more than 35 genes remaining to be detected or validated. These 88 miRNA genes represent 48 gene families; 46 of these families (comprising 86 of the 88 genes) are conserved in Caenorhabditis briggsae, and 22 families are conserved in humans. More than a third of the worm miRNAs, including newly identified members of the lin-4 and let-7 gene families, are differentially expressed during larval development, suggesting a role for these miRNAs in mediating larval developmental transitions. Most are present at very high steady-state levels-more than 1000 molecules per cell, with some exceeding 50,000 molecules per cell. Our census of the worm miRNAs and their expression patterns helps define this class of noncoding RNAs, lays the groundwork for functional studies, and provides the tools for more comprehensive analyses of miRNA genes in other species.


Figures

Figure 1
Figure 1
Criteria used by MiRscan to identify miRNA genes among aligned segments of two genomes. (A) The seven components of the MiRscan score for mir-232 of C. elegans/C. briggsae. These components are annotated in the context of the MiRscan prediction for mir-232, with the residues of the predicted miRNA circled in purple and the residues of the validated miRNA (Table 2), circled in green. In parenthesis are the scores for each component, which were added together to give the total score of 13.9. MiRscan predictions are visualized within the consensus C. elegans/C. briggsae secondary structure, as generated by using ClustalW (Thompson et al. 1994) and Alidot (Hofacker and Stadler 1999). Shown is the C. elegans sequence with residues colored to indicate conserved sequence and pairing potential. Residues conserved in C. briggsae are red, residues that vary while maintaining their predicted paired or unpaired state are blue (with variant residues that maintain pairing also circled in black), and residues that maintain neither sequence nor pairing are in gray. (B) Estimated relative importance of each MiRscan criterion. Estimates were based on the relative entropy between the training set of 50 previously identified nematode miRNAs and the background set of ∼36,000 potential stem loops. Because pairing and conservation were used to identify the potential stem loops, the total contributions of these types of criteria for distinguishing miRNA genes from non-protein-coding genomic sequence were underestimated. Likewise, the total contribution of the distance from the loop was underestimated because only those candidates 2–9 bp from the loop were evaluated.
Figure 2
Figure 2
Computational identification of miRNA genes. (A) The distribution of MiRscan scores for 35,697 C. elegans sequences that potentially form stem loops and have loose conservation in C. briggsae. Note that the Y-axis is discontinuous so that the scores of the 50 previously reported miRNA genes that served as the training set for MiRscan can be more readily seen (red). Scores for these 50 genes were jackknifed to prevent inflation of their values because of their presence in the training set. (B) An expanded view of the high-scoring tail of the distribution. This view captures 49 of the 50 genes of the training set (red). The median score of the 58 previously reported miRNA loci that satisfy the current criteria for designation as miRNA genes (Ambros et al. 2003) is 13.9 (green arrow). Note that this median score was the midpoint between the scores of the 29th and 30th highest-scoring loci of the 50-member training set; namely, it was designated the median score after including the 8 previously reported miRNA genes that were not in the training set because they were lost during the identification of conserved hairpins, usually because they lacked sufficient C. briggsae homology. Scores of genes validated by cloning are indicated (yellow), as are scores of six genes that have not yet been cloned but were verified by Northern analysis (purple). (C) Examples of miRNA genes identified by MiRscan with the Northern blots that served to validate them. Stem-loops were annotated as in Figure 1A, except the DNA rather than RNA sequence is depicted. The Northern blots show analysis of RNA from either wild-type (N2) or dcr-1 worms, isolated using either our standard protocol (Std.) or an additional polyethylene glycol precipitation step to enrich for small RNAs (Enr.). Homozygous worms of the dcr-1 population have reduced Dicer activity, increasing the level of miRNA precursors (e.g., miR-250-L and miR-255-L), which facilitated the validation of miRNA loci, especially those for which the mature miRNA was not detected (e.g., miR-255). RNA markers (left lane) are 18, 21, 24, 60, 78, and 119 nt. The miR-250 stem loop shown received a MiRscan score of 14.7. The mir-250 reverse complement received an even greater score of 18.4, but was not detected by Northern analysis. Thus, the predicted mir-250 gene was assigned the score of the higher-scoring, although incorrect, alternative stem loop (Table 1; Fig. 2B).
Figure 3
Figure 3
Alignments of C. elegans and human miRNA sequences that can be grouped together in families. Human miRNAs (Hs) are those identified in human cells (Lagos-Quintana et al. 2001; Mourelatos et al. 2002) or are orthologs of miRNAs identified in other vertebrates (Lagos-Quintana et al. 2002, 2003; Lim et al. 2003).
Figure 4
Figure 4
Expression of C. elegans miRNAs during larval development. Total RNA was analyzed from mixed-stage N2 worms (M), embryos (E), larval stages (L1, L2, L3, L4), adults (A), glp-4(bn2) adults (G), N2 dauers (D), mixed-stage him-8(e1489) worms (H), and N2 starvation-arrested L1 larvae (sL1). Intense signals are represented as black rectangles and faint signals are represented as gray rectangles. Of the 87 C. elegans miRNAs identified, 6 could not be detected on developmental Northerns (miR-41, miR-78, miR-249, miR-253, miR-254, and miR-255). (A) miRNAs constitutively expressed throughout nematode development. (B) stRNAs, lin-4 and let-7, and similarly expressed miRNAs, which commence expression during larval development and remain expressed through adulthood. (C) miRNAs with discontinuous developmental expression patterns. (D) Northern analysis of miRNAs with enhanced expression in the dauer stage. To control for loading, the blot used for both miR-234 and miR-248 and the blot used for miR-247 were reprobed for the U6 snRNA (U6). Quantitation with a PhosphorImager showed that the lane-to-lane variation in U6 signal was as great as threefold. Normalizing to the U6 signal, the miR-248 signal was fourfold greater in dauer than in most other stages, except for glp-4 adults, in which it was twofold greater, whereas the miR-234 signal was highest in dauer and L1, with a signal in these stages about twofold greater than the average of the other stages. (E) Northern analysis of the lin-4 RNA and its paralog, miR-237.
Figure 5
Figure 5
Quantitative analysis of miRNA expression. (A) Northern blot used to quantify the abundance of miR-66. RNA prepared from the wild-type (N2) mixed-stage worms used in cloning and from glp-4(bn2) young adult worms were run in duplicate with a concentration course of synthetic miRNA standard. The signal from the standard did not change when total RNA from HeLa cells replaced E. coli tRNA as the RNA carrier, showing that the presence of other miRNAs did not influence membrane immobilization of the miRNA or hybridization of the probe. (B) Standard curve from quantitation of miR-66 concentration course. The best fit to the data is a line represented by the equation y = 3.3x0.96 (R2 = 0.99). Interpolation of the average signal in the glp-4 lanes indicates that the glp-4 samples contain 240 pg of miR-66 (broken lines). (C) Molecular abundance of miRNAs and U6 snRNA. Amounts of the indicated RNA species in the glp-4 samples were determined as shown in A and B. The average number of molecules per cell was then calculated considering the number of animals used to prepare the sample, and the yield of a radiolabeled miRNA spiked into the preparation at an early stage of RNA preparation. Analogous experiments were performed to determine the amounts of the indicated human miRNAs in HeLa RNA samples. (D) Correlation between miRNA molecular abundance and cloning frequency. The number of molecules in the mixed-stage RNA samples was determined as described for the glp-4 samples and then plotted as a function of the number of times the miRNAs was cloned from this mixed-stage population (Table 1). The line is best fit to the data and is represented by the equation y = 0.32x (R2 = 0.78).
Figure 6
Figure 6
miRNA (red) and miRNA* (blue) sequences within the context of their predicted fold-back precursors. The number of sequenced clones is shown in parentheses. For each miRNA and miRNA*, colored residues are those for the most frequently cloned species. There was 3′ heterogeneity among the sequenced clones for some miRNA*s and most miRNAs. Heterogeneity at the 5′ terminus was not seen among the sequenced clones for the miRNA*s and was rare among those for the miRNAs; when it occurred, it was not observed for more than one of the many clones representing each miRNA.
Figure 7
Figure 7
Plot illustrating the absence of a correlation between the MiRscan score of a cloned miRNA and the number of times that miRNA was cloned and sequenced. Nine of 80 cloned loci of Table 2 were not scored (left) because potential homologs of these genes were not identified among the available C. briggsae sequencing reads.

References

    1. Ambros V, Bartel B, Bartel DP, Burge CB, Carrington JC, Chen X, Dreyfuss G, Eddy S, Griffiths-Jones S, Matzke M, et al. A uniform system for microRNA annotation. RNA. 2003;9:277–279. - PMC - PubMed
    1. Aravin AA, Naumova NM, Tulin AA, Rozovsky YM, Gvozdev VA. Double-stranded RNA-mediated silencing of genomic tandem repeats and transposable elements in D. melanogaster germline. Curr Biol. 2001;11:1017–1027. - PubMed
    1. Argaman L, Hershberg R, Vogel J, Bejerano G, Wagner EG, Margalit H, Altuvia S. Novel small RNA-encoding genes in the intergenic regions of Escherichia coli. Curr Biol. 2001;11:941–950. - PubMed
    1. Beanan MJ, Strome S. Characterization of a germ-line proliferation mutation in C. elegans. Development. 1992;116:755–766. - PubMed
    1. Bernstein E, Caudy AA, Hammond SM, Hannon GJ. Role for a bidentate ribonuclease in the initiation step of RNA interference. Nature. 2001;409:295–296. - PubMed

Publication types

MeSH terms