Comparative Study
. 2003 Apr 15;17(8):1043-54.
doi: 10.1101/gad.1077503. Epub 2003 Apr 2.

ICE1: a regulator of cold-induced transcriptome and freezing tolerance in Arabidopsis

Affiliations
Comparative Study

ICE1: a regulator of cold-induced transcriptome and freezing tolerance in Arabidopsis

Viswanathan Chinnusamy et al. Genes Dev. .

Abstract

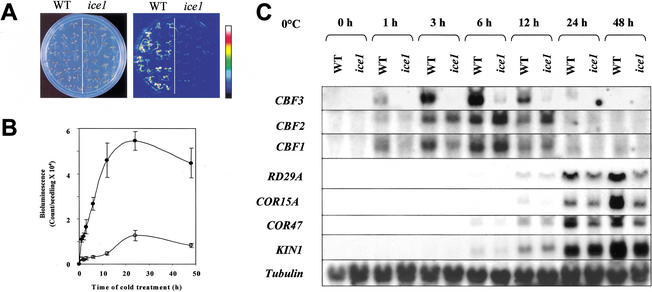
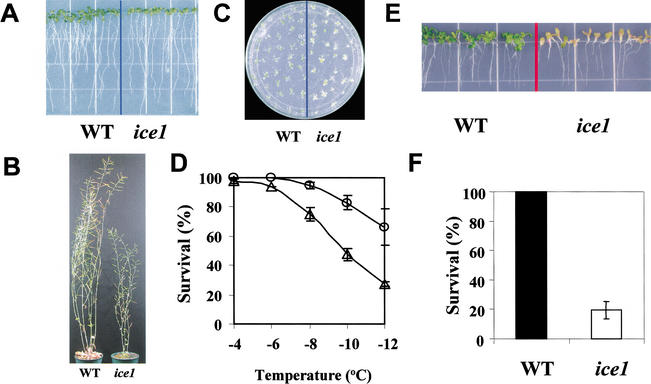
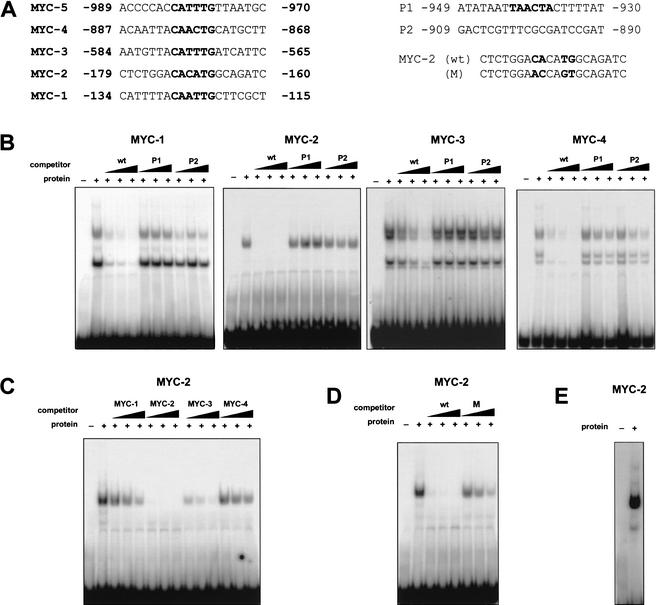
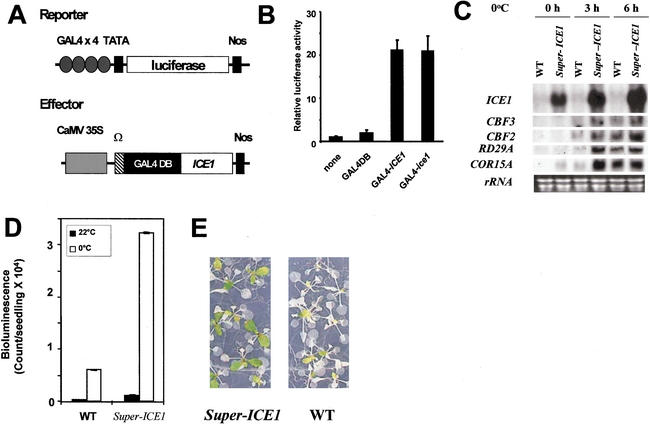
Cold temperatures trigger the expression of the CBF family of transcription factors, which in turn activate many downstream genes that confer chilling and freezing tolerance to plants. We report here the identification of ICE1 (inducer of CBF expression 1), an upstream transcription factor that regulates the transcription of CBF genes in the cold. An Arabidopsis ice1 mutant was isolated in a screen for mutations that impair cold-induced transcription of a CBF3 promoter-luciferase reporter gene. The ice1 mutation blocks the expression of CBF3 and decreases the expression of many genes downstream of CBFs, which leads to a significant reduction in plant chilling and freezing tolerance. ICE1 encodes a MYC-like bHLH transcriptional activator. ICE1 binds specifically to the MYC recognition sequences in the CBF3 promoter. ICE1 is expressed constitutively, and its overexpression in wild-type plants enhances the expression of the CBF regulon in the cold and improves freezing tolerance of the transgenic plants.


Figures

Figure 1
Figure 1
The ice1 mutation blocks the cold-induction of CBF3 and affects the expression of other cold-responsive genes. (A) Morphology (left) and CBF3–LUC luminescence images (right) of wild-type and ice1 seedlings. Luminescence images of the plants were collected after 12 h of cold (0°C) treatment. (B) Quantitation of the luminescence intensities of wild-type (solid circles) and ice1 (open circles) seedlings in response to different durations of cold treatment. (C) Transcript levels of CBFs and their downstream target genes in wild-type and ice1 plants in response to cold treatment. Seedlings were either not treated (0 h) or treated with cold (0°C) for the indicated durations (h). The tubulin gene was used as a loading control. WT, wild type.
Figure 2
Figure 2
Morphology and freezing and chilling sensitivity of ice1 mutant plants. (A) Wild-type and ice1 seedlings in nutrient medium on agar under normal growth conditions. (B) Wild-type and ice1 plants in soil under normal growth conditions. (C) ice1 plants are defective in cold acclimation. Ten-day-old seedlings grown at 22°C were incubated for 4 d in light at 4°C before freezing treatment at −12°C. The picture was taken 3 d after the freezing treatment. (D) Comparison of survival rates after freezing treatments at the indicated temperatures. Open circles and open triangles represent wild-type and ice1 plants, respectively. (E) ice1 plants are sensitive to prolonged chilling treatment. After germination at 22°C, the plants were grown at 4°C for 6 wk. (F) Comparison of survival rates after 6 wk of chilling stress.
Figure 3
Figure 3
Confirmation of ICE1 gene cloning by expressing the dominant ice1 mutant allele in wild-type plants. (A) Expression in wild type of a genomic fragment containing the ice1 mutation recapitulates the ice1 mutant phenotype. Seven-day-old seedlings of the wild type, ice1, and wild type transformed with the mutant ice1 gene grown on MS agar medium were subjected to luminescence imaging after 12 h of cold (0°C) stress. (B) Quantitation of CBF3–LUC bioluminescence levels in wild type (WT), ice1 and wild type transformed with the mutant ice1 gene after 12 h of cold (0°C) stress.
Figure 4
Figure 4
ICE1 encodes a bHLH protein. (A) Overall domain structure of ICE1 protein. A putative acidic domain (acidic), serine-rich region (S-rich), bHLH domain, and possible zipper region (ZIP) are indicated. The arrow indicates the amino acid residue changed in the ice1 mutant. (B) Sequence alignment of the bHLH domains and ZIP regions of ICE1 and other plant and animal bHLH proteins. Identical and similar residues are shown in black and gray, respectively. The basic region is indicated by a bold line and the helix–loop–helix domain is indicated by open boxes connected with a loop. The zipper region is indicated as a broken line. DDJB/EMBL/GenBank accession numbers, with amino acid numbers in parentheses, are: ICE1, AY195621 (300–398); At1g12860, NM_101157 (638–731); At5g65640, NM_125962.1 (171–269); At5g10570, NM_121095.2 (144–242); rd22BP, AB000875 (446–544); ATR2, NM_124046.1 (409–507); maize R gene, M26227 (410–508); TT8, AJ277509 (357–455); PIF3, AF100166 (254–352); PIF4, AJ440755 (255–353); MAX, P52161 (21–107); c-myc, 1001205A (354–435). Asterisks indicate amino acid residues of MAX that are known to interact with nucleotides (Grandori et al. 2000).
Figure 5
Figure 5
Expression of the ICE1 gene and subcellular localization of the ICE1 protein. (A) ICE1 promoter-driven GUS expression pattern in a wild-type seedling. (B) ICE1 promoter-GUS expression in different plant tissues, and the corresponding ICE1 transcript levels as determined by RT–PCR analysis. The tubulin gene was used as an internal control in the RT–PCR. (C) RNA blot analysis of ICE1 expression in wild-type seedlings under various abiotic stresses. Plants with the following treatments are shown: control, MS salt only; NaCl, 300 mM NaCl for 5 h; ABA, 100 μM abscisic acid for 3 h; Cold, 0°C for 2 h; Dehydration, air drying for 30 min. (D) Localization of GFP–ICE1 fusion protein in the nucleus. Panels a–c show confocal images of root cells in GFP–ICE1 transgenic plants, and panel d shows the location of nuclei as indicated by propidium stain.
Figure 6
Figure 6
ICE1 protein binds to the MYC-recognition elements in the CBF3 promoter. (A) Sequences and positions of oligonucleotides within the CBF3 promoter used in the EMSA. Letters in bold indicate sequences of MYC-recognition motifs in MYC-1 through MYC-5. Bold letters in the P1 oligonucleotide are a putative MYB-recognition motif. (B) Interaction between ICE1 protein and 32P-labeled MYC-1 through MYC-4 DNA fragments. (C) ICE1 binds to the MYC-2 DNA fragment more strongly than to the other DNA fragments. (D) Consensus nucleotide residues in the MYC-recognition motif are important for the interaction between ICE1 and the MYC-2 DNA fragment. (E) ice1 mutant protein also binds to the MYC-2 DNA fragment. The labeled oligonucleotides used in each experiment are indicated at the top of each panel. Triangles indicate increasing amounts of unlabeled oligonucleotides for competition in B, C and D, which correspond to 50-, 100-, and 250-fold excess of each probe.
Figure 7
Figure 7
ICE1 is a transcriptional activator and its overexpression enhances the CBF regulon in the cold and improves freezing tolerance. (A) Schematic representation of the reporter and effector plasmids used in the transient expression assay. A GAL4-responsive reporter gene was used in this experiment. Nos, the terminator signal of the nopaline synthase gene; Ω, the translational enhancer of tobacco mosaic virus; GAL4 DB, the DNA-binding domain of the yeast transcription factor GAL4. (B) Relative luciferase activities after transfection with GAL4–LUC and 35S-GAL4–ICE1 or 35S-GAL4–ice1. To normalize values obtained after each transfection, a gene for luciferase from Renilla was used as an internal control. Luciferase activity is expressed in arbitrary units relative to the activity of Renilla luciferase [as described in Ohta et al. (2001)]. The values are averages of three bombardments, and error bars indicate standard deviations. (C) RNA blot analysis of ICE1 and cold-responsive gene expression in wild-type and ICE1 overexpressing transgenic (Super-ICE1) plants. Seedlings were either not treated (0 h) or treated with low temperature (0°C) for 3 or 6 h. Ethidium bromide stained rRNA bands are shown as loading control. (D) CBF3–LUC expression (indicated as luminescence intensity) in wild-type and ICE1 overexpressing transgenic (Super-ICE1) plants. (E) Improved survival of ICE1 overexpressing transgenic (Super-ICE1) plants after a freezing treatment.

Similar articles

Cited by

References

    1. Browse J, Xin Z. Temperature sensing and cold acclimation. Curr Opin Plant Biol. 2001;4:241–246. - PubMed
    1. Chinnusamy, V., Stevenson, B., Lee, B., and Zhu, J. 2002. Screening for gene regulation mutants by bioluminescence imaging. Science's STKE http://stke.sciencemag.org/cgi/content/full/sigtrans;2002/140/pl10. - PubMed
    1. Fowler S, Thomashow MF. Arabidopsis transcriptome profiling indicates that multiple regulatory pathways are activated during cold acclimation in addition to the CBF cold response pathway. Plant Cell. 2002;14:1675–1690. - PMC - PubMed
    1. Gilmour SJ, Artus NN, Thomashow MF. cDNA sequence analysis and expression of two cold regulated genes of Arabidopsis thaliana. Plant Mol Biol. 1992;18:13–32. - PubMed
    1. Gilmour SJ, Zarka DG, Stockinger EJ, Salazar MP, Houghton JM, Thomashow MF. Low temperature regulation of the Arabidopsis CBF family of AP2 transcriptional activators as an early step in cold-induced COR gene expression. Plant J. 1998;16:433–442. - PubMed

Publication types

MeSH terms