. 2003 Apr 15;100(8):4592-7.
doi: 10.1073/pnas.0736739100. Epub 2003 Apr 2.

The endomembrane requirement for cell surface repair

Collaborators, Affiliations

The endomembrane requirement for cell surface repair

Paul L McNeil et al. Proc Natl Acad Sci U S A. .

Abstract

The capacity to reseal a plasma membrane disruption rapidly is required for cell survival in many physiological environments. Intracellular membrane (endomembrane) is thought to play a central role in the rapid resealing response. We here directly compare the resealing response of a cell that lacks endomembrane, the red blood cell, with that of several nucleated cells possessing an abundant endomembrane compartment. RBC membrane disruptions inflicted by a mode-locked Ti:sapphire laser, even those initially smaller than hemoglobin, failed to reseal rapidly. By contrast, much larger laser-induced disruptions made in sea urchin eggs, fibroblasts, and neurons exhibited rapid, Ca(2+)-dependent resealing. We conclude that rapid resealing is not mediated by simple physiochemical mechanisms; endomembrane is required.


Figures
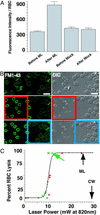
Figure 1
Figure 1
Plasma membrane disruptions can be produced in RBCs with a mode-locked Ti:sapphire laser. (A) Fluorescence intensity was measured from individual RBCs immersed in FM1-43 dye in d-PBS/+Ca before and after a 4.8-μs-per-pixel exposure to mode-locked (ML) or non-mode-locked (Mock) Ti:sapphire radiation. All points are mean ± SEM, with 19 RBCs being irradiated and 14 being mock-treated. The after ML mean value was significantly different from control values as determined by ANOVA (P < 0.0001). (B) FM1-43 fluorescence images (FM1-43, Left) and scanning DIC microscopy images (DIC, Right) of RBCs. The RBCs in the left half of the field (within the red box) were exposed to 44.8 μs per pixel mode-locked Ti:sapphire radiation at a 24.8-mW average and imaged 1 min after irradiation (Middle). The right side of the field was not exposed to mode-locked radiation as a negative internal control. Next, the cells in a region of interest on the right side of the field (within the blue box) were exposed to 44.8 μs per pixel continuous-wave Ti:sapphire radiation at a 29.4-mW average and imaged 1 min after irradiation (Bottom). (Scale bars, 10 μm.) (C) The fraction of cells whose FM1-43 fluorescence increased was measured by direct counting of images before and after mode-locked Ti:sapphire laser irradiation as described in A. Percent RBC lysis is plotted as a function of the average power of the Ti:sapphire laser output (as measured with a power meter at the objective). Each point represents data calculated from ≈20 cells exposed to 4.8 μs per pixel laser irradiation, with RBCs from two different animals (red and green dots). The dashed line is a sigmoidal fit through the data. The green arrow shows the data and power exposure depicted in A. The black arrows show the power exposure for the mode-locked (ML) and continuous-wave (CW) experiment depicted in B. Note that the time of laser exposure in B was ≈10 times the exposure time for the experiments shown in A and C.
Figure 2
Figure 2
Imaging and quantitative analysis of intracellular FM1-43 staining after laser-mediated cell membrane disruption. (A) The plasma membrane of a single RBC was laser-irradiated (red arrow indicates timing) across a 1-μm-wide zone (arrowheads) in the presence of 1 μM FM1-43 dye d-PBS/+Ca. A disruption was produced, causing an immediate increase in FM1-43 staining (green dots in graph). Loss of hemoglobin (evident in the DIC images as a loss of birefringence) was not detectable until ≈100 s afterward (compare +90s and +250s DIC images). Fluorescence continued to rise for ≈200 s after the disruption was made, peaking at an ≈2-fold higher level than prewound or control (nonwounded) cell values (black squares). At the point indicated by the black arrow, the preparation was perfused with dye-free medium. The fluorescence of the wounded RBC then dropped below its initial (intact state) level. (B) Laser irradiation was used to sever an ≈2.5-μm-diameter process (arrowheads) of a fibroblast in either d-PBS/+Ca (Top) or d-PBS/−Ca (Middle). FM1-43 dye entry into the fibroblast wounded in Ca2+ ceased ≈30 s after laser irradiation (green dots in graph). In contrast, dye entry into the fibroblast wounded in the absence of Ca2+ continued throughout the 220-s duration of the experiment (red triangles). The fluorescence of control cells (black dots, diamonds), not wounded with the laser, remained relatively constant throughout. (C) A single sea urchin egg is first wounded (white arrowheads mark the location of an ≈10-μm-wide irradiation area) in complete artificial seawater (≈10 mM Ca2+; Top and Middle) and, a second time, with the same laser intensity and geometry, in seawater lacking added Ca2+ (Bottom). As illustrated in the images and depicted quantitatively in the graph (red squares for minus Ca2+; blue triangles for plus Ca2+), FM1-43 dye entry is virtually undetectable if Ca2+ is present, but enters freely in its absence. In the presence of Ca2+, the irradiation site is marked by the local elevation of fertilization envelope (visible in the +200s DIC image), confirming that a disruption was made. In the absence of Ca2+, cytoplasmic contents, including organelles at least 1 μm in diameter, spill out through the identically created disruption (450-s fluorescence image), indicating a wound at least 1 μm across. (Scale bar, 10 μm.)
Figure 3
Figure 3
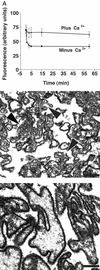
FM1-43 assessment of RBC resealing after hyposmotic shock in the presence and absence of Ca2+ ions. (A) RBCs were lysed by resuspension in cold hyposmotic buffer containing either 1.0 mM CaCl2 (triangles) or no CaCl2 addition (squares). Isotonicity was restored by the addition of 10× PBS/+Ca or PBS/−Ca, respectively, and, at various intervals after initiating warming to 37°C, the RBCs were diluted into cold d-PBS/+Ca containing FM1-43, and their fluorescence was measured. The “zero” (first) time point was obtained from lysed RBCs that were not warmed (preventing resealing) before dye exposure. Triplicate measurements are shown (bars, 1 SD). (B) Electron micrograph of RBCs lysed in physiological Ca2+ and fixed 5 min after warming in d-PBS/+Ca to 37°C. (C) Electron micrograph of RBCs lysed in the absence of added Ca2+ and fixed 5 min after warming in PBS/−Ca. (Scale bars, 1 μm.)
Figure 4
Figure 4
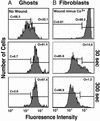
Flow analysis of FM1-43 staining after shear-induced plasma membrane disruption. (A Top) A dye-impermeable population of ghosts [C (closed) indicates their percentage of the total population in each case] was present in undisturbed blood and was used to establish a threshold (vertical bars, left). Ghosts with fluorescence intensities beyond this threshold were classified as dye permeable [O (open) gives the percentage in each case]. Greater than 90% of all ghosts present after scraping were dye-permeable at all time points examined: 30 s (Middle), 90 s (not shown), 300 s (Bottom), and 4,800 s (not shown). Attempts to wound RBCs by scraping in d-PBS/−Ca failed, probably because RBC adhesion to the plates was reduced under this condition. (B Top) Fibroblasts were scraped in d-PBS/−Ca and added 300 s afterward to cold FM1-43 in d-PBS/+Ca. Alternatively, the cells were scraped in d-PBS/+Ca and then at 30 s (Middle) and 300 s (Bottom) after scraping diluted into dye. Dye-permeant (the percentage in each case is indicated by O values, as above for ghosts) fibroblasts are defined as those with fluorescence intensities above a threshold set to contain 95% of an undisturbed fibroblast population (not shown).

References

    1. McNeil P L. Trends Cell Biol. 1993;3:302–307. - PubMed
    1. Lemasters J L, DiGuiseppi J, Nieminen A-L, Herman B. Nature. 1987;325:78–81. - PubMed
    1. Steinhardt R A, Bi G, Alderton J M. Science. 1994;263:390–393. - PubMed
    1. Miyake K, McNeil P L. J Cell Biol. 1995;131:1737–1745. - PMC - PubMed
    1. Bi G-Q, Alderton J M, Steinhardt R A. J Cell Biol. 1995;131:1747–1758. - PMC - PubMed

Publication types

MeSH terms