. 2003 Apr 15;100(8):4574-9.
doi: 10.1073/pnas.0730733100. Epub 2003 Apr 2.

Processing, localization, and requirement of human separase for normal anaphase progression

Affiliations

Processing, localization, and requirement of human separase for normal anaphase progression

Anton Chestukhin et al. Proc Natl Acad Sci U S A. .

Abstract

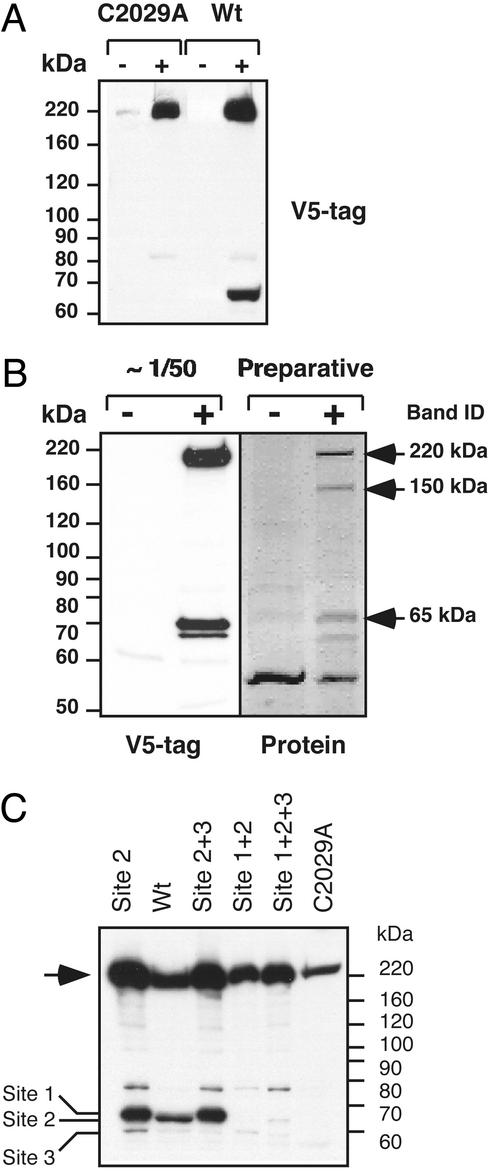
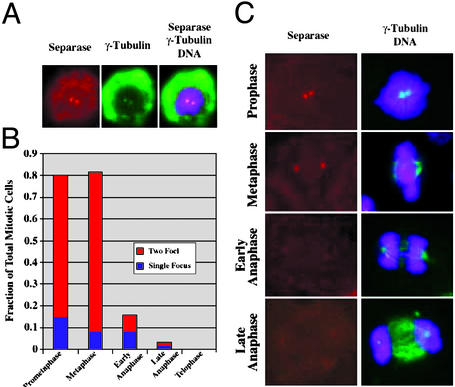
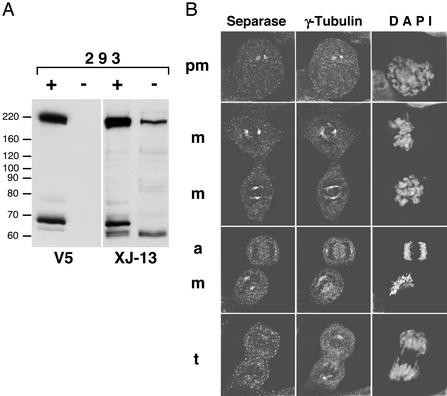
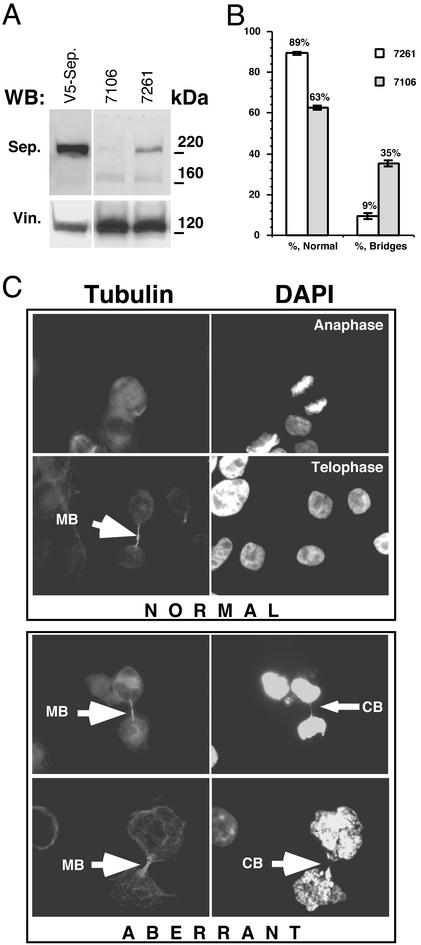
In all eukaryotes, anaphase is triggered by the activation of a protease called separase. Once activated, separase cleaves a subunit of cohesin, a complex that links replicated chromatids before anaphase. Separase and cohesin are conserved from yeasts to humans. Although the machinery for dissolving sister cohesion is conserved, the regulation of this process appears to be more complex in higher eukaryotes than in yeast. Here we report the cloning of full-length human separase cDNA and the characterization of the encoded protein. Human separase was observed at the poles of the mitotic spindle until anaphase, at which time its association with the mitotic spindle was abruptly lost. The dynamic pattern of localization of human separase during cell cycle progression differs from that of fungal separases. Human separase also appears to undergo an autocatalytic processing on anaphase entry. The processed forms of human separase were isolated and the identity of the cleavage sites was determined by N-terminal sequencing and site-directed mutagenesis. The processed catalytic domain was found to be stably associated with the processed N-terminal fragment. Finally, by depletion of endogenous separase with antisense oligonucleotides, we report direct evidence that separase is required for high-fidelity chromosome separation in human cells.


Figures

Figure 1
Figure 1
Autocatalytic activity of separase at multiple sites is required for posttranslational processing of the enzyme. (A) Addition of ponasterone-induced (+) expression of V5-epitope C-terminally tagged C2029A mutant separase or wild-type (wt) separase in 293 cells. Uninduced cells (−) were used as a control. The C2029A mutant appears as a single polypeptide band corresponding to the full-length molecule. Expression of the wild-type separase results in appearance of a 65-kDa cleavage product. The membrane was probed with V5 antibodies. (B) Identification of the major cleavage site in human separase. Expression of V5-epitope tagged wild-type separase was induced for 14 h and immunoprecipitated with V5-tag antibodies. Ninety-five percent of the precipitated proteins were separated by SDS/PAGE, visualized by Ponceau S staining (Preparative), or used for Western blotting with V5 antibodies. N-terminal sequencing analysis was performed on the 220-, 150-, and 65-kDa protein bands, indicated by the arrows. Sequencing results are given in the text. + and −, induced and noninduced cells, respectively. (C) C-terminally epitope-tagged separase and mutant derivatives were transiently expressed in HeLa cells, and the whole-cell extracts were analyzed by Western blot with V5 antibodies (see text for the description of the mutants). Full-length separase (arrow) and the proteolytic fragments resulting from cleavage at each of the three sites are indicated (left).
Figure 2
Figure 2
Cellular localization of human separase: polyclonal antibodies. Shown is immunofluorescence of mitotic HeLa cells, where separase-specific fluorescence is red, γ-tubulin is green, and DNA staining is purple. (A) Prophase HeLa cells displays colocalization of separase (red) with γ-tubulin (green), as evident from superimposition of the images (yellow). (B) Ratio of the number of the cells containing separase labeling of centrosome to the total number of cells at the indicated stages of mitosis (n > 100 cells at each cell cycle stage). Note that anaphase cells were scored as positive for separase even if the staining was fainter than that observed for metaphase cells. The numbers therefore likely underestimate the degree to which separase is lost from centrosomes at anaphase. (C) Immunofluorescence images of prophase, metaphase, and anaphase in HeLa cells showing separase, γ-tubulin, and DNA staining. Shown are representative images from the analysis in B.
Figure 3
Figure 3
Detection of endogenous human separase: monoclonal antibodies. (A) Whole-cell extracts were prepared from control 293 cells (−) or the cells induced to express recombinant V5-tagged full-length separase (+). Identical panels were probed with either V5-tag-specific (V5) or separase-specific (XJ-13) mAbs. (B) Endogenous separase was detected in 293 cells by using XJ-13 mAb and a TRITC-labeled secondary Ab, γ-tubulin was stained by polyclonal Ab, and Cy2-labeled secondary Ab and DNA was visualized by 4′,6-diamidino-2-phenylindole staining. pm, m, a, and t, prometaphase, metaphase, anaphase, and telophase cells, respectively.
Figure 4
Figure 4
Transfection with various antisense oligonucleotides results in depletion of separase. (A) HeLa cells were transfected with 7106 and control 7621 oligonucleotides at a final concentration of 500 nM. Twenty-four hours after transfection, the cells were harvested in sample buffer and separated in SDS/PAGE. The steady-state levels of separase were compared by Western blot by using antiseparase polyclonal antibodies. V5-Sep., the lane where transfected V5-tagged human separase was loaded as a control. After separase detection, the membrane was stripped and reprobed with anti-Vinculin antibodies (Vin.), confirming the equal loading of the samples. (B) The relative numbers of cells undergoing anaphase after transfection with oligonucleotides 7106 or 7621. The ratio of abnormal bridging chromosomes to the total number of mitotic cells was calculated by counting >500 mitotic cells from three independent experiments. (C) Examples of normal and abnormal anaphase figures from the experiment described in B. MB indicates midbody, and CB indicates a chromosomal bridge.

References

    1. Uhlmann F, Nasmyth K. Curr Biol. 1998;8:1095–1101. - PubMed
    1. Orr-Weaver T L. Cell. 1999;99:1–4. - PubMed
    1. Nasmyth K. Trends Biochem Sci. 1999;24:98–104. - PubMed
    1. Amon A. Nat Cell Biol. 2001;3:E12–E14. - PubMed
    1. Nasmyth K, Peters J M, Uhlmann F. Science. 2000;288:1379–1385. - PubMed

Publication types

LinkOut - more resources