Comparative Study
. 2003 Apr 15;100(8):4873-8.
doi: 10.1073/pnas.0636925100. Epub 2003 Apr 2.

Neural, not gonadal, origin of brain sex differences in a gynandromorphic finch

Affiliations
Comparative Study

Neural, not gonadal, origin of brain sex differences in a gynandromorphic finch

Robert J Agate et al. Proc Natl Acad Sci U S A. .

Abstract

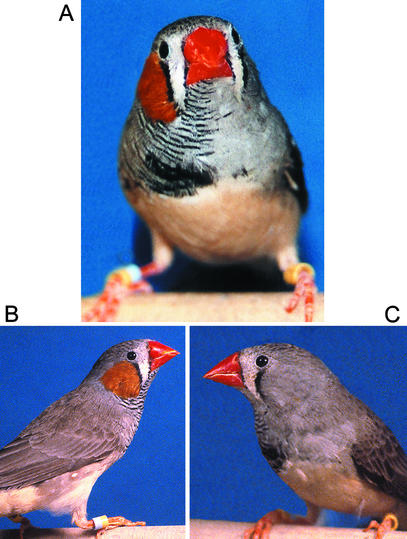
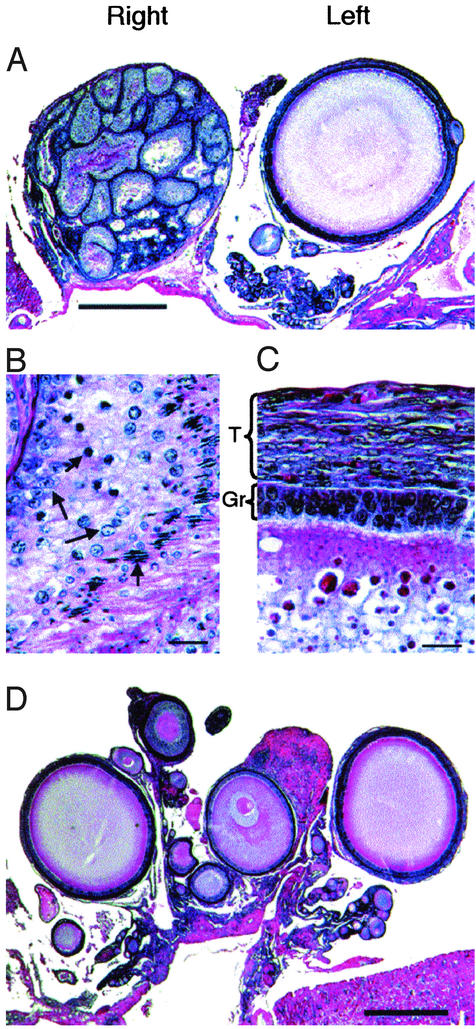
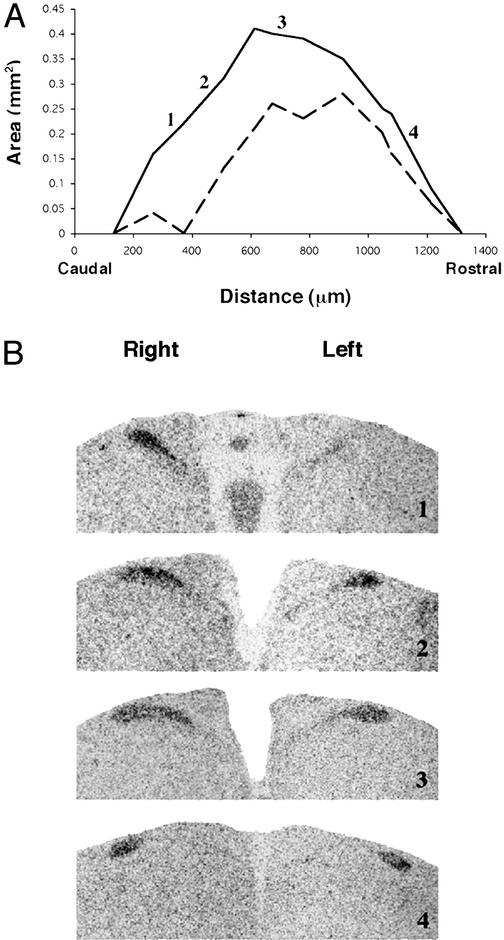
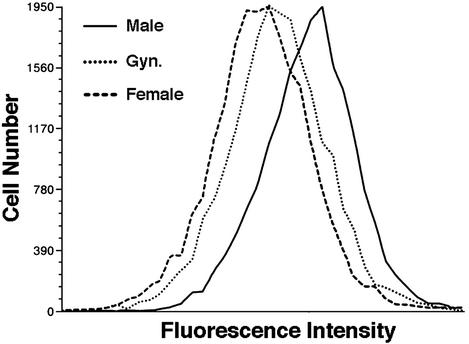
In mammals and birds, sex differences in brain function and disease are thought to derive exclusively from sex differences in gonadal hormone secretions. For example, testosterone in male mammals acts during fetal and neonatal life to cause masculine neural development. However, male and female brain cells also differ in genetic sex; thus, sex chromosome genes acting within cells could contribute to sex differences in cell function. We analyzed the sexual phenotype of the brain of a rare gynandromorphic finch in which the right half of the brain was genetically male and the left half genetically female. The neural song circuit on the right had a more masculine phenotype than that on the left. Because both halves of the brain were exposed to a common gonadal hormone environment, the lateral differences indicate that the genetic sex of brain cells contributes to the process of sexual differentiation. Because both sides of the song circuit were more masculine than that of females, diffusible factors such as hormones of gonadal or neural origin also likely played a role in sexual differentiation.


Figures

Figure 1
Figure 1
Zebra finch gynandromorph (A) with male plumage on its right side (B) and female plumage on its left side (C). A few black male feathers can be seen on the left breast in A.
Figure 2
Figure 2
Sound spectrogram and amplitude plot of the gynandromorph song show characteristics of normal male song: typical bout structure, with introductory notes and loud end notes, and typical frequency modulation.
Figure 3
Figure 3
Photomicrographs of histological sections of the gonads. On the animal's right side was a dysmorphic testis (A, bar = 0.5 mm) comprising a mixture of seminiferous tubules with unusually large or small lumens containing germ cells at all stages of spermatogenesis (arrows in B, bar = 20 μm). Ovarian tissue was limited to the animal's left side and contained a number of follicles at different stages seen in two planes of section (A and D). A single mature follicle is seen in A, Left. Higher magnification (C, bar = 20 μm) shows normal theca (T) and granulosa (Gr) cell layers.
Figure 4
Figure 4
The volume of song nucleus HVC was lateralized more in the gynandromorph than in normal males. Lateral differences in the gynandromorph song nuclei (black circles) were compared with lateral differences in multiple control males (shaded circles). For each nucleus, the left column represents males in which the left side was larger, and the right column represents values when the right side was larger. Percent difference is (R − 1) × 100, where R = ratio of volume of larger side divided by volume of smaller side.
Figure 5
Figure 5
(A) Graph of the area of HVC in individual Nissl-stained sections from the caudal to rostral extent of the nucleus, demonstrating a significant lateral difference in nucleus volume. Right is solid line; left is dashed line. (B) Inverted dark field autoradiograms of in situ hybridization showing the distribution of AR mRNA (dark areas) to mark HVC at various levels, confirming the lateral difference in HVC size. Numbers on the autoradiograms show level of sections on the graph.
Figure 6
Figure 6
Photomicrographs of in situ hybridization in brain sections using Z and W chromosome-specific probes. Autoradiograms were photographed in dark field and then black–white inverted; thus dark areas show label. (A) mRNA encoding the W chromosome gene, ASW, was ubiquitous on the left side but virtually absent on the right. The dividing line of high and low expression is sharp and follows the midline of the brain. (B) mRNA encoding the Z-linked gene PKCIZ was ubiquitous but higher on the right side of the brain, compatible with the idea that the brain was ZW on the left and ZZ on the right. (Bar = 1.0 mm.)
Figure 7
Figure 7
Dark-field photomicrograph of autoradiogram showing in situ hybridization of a probe recognizing ASW in the cerebellum. The uniformly high expression of ASW mRNA can be seen in left-side Purkinje cells and granule cells, extending to the midline (arrows). Labeling for ASW decreased abruptly on the right side beginning at the midline. However, some Purkinje cells were labeled for ASW on the right side (box), and granule cells closer to the midline were labeled more than those farther from the midline. (Bar = 0.5 mm.)
Figure 8
Figure 8
Analysis of lateralization of sex chromosomes. (A) PCR products representing fragments of CHD1Z and CHD1W amplified from genomic DNA from the right (1) and left (2) sides of the gynandromorph brain. CHD1W (upper band) was predominantly restricted to the left side of the brain, suggesting a lateralization of the W sex chromosome. CHD1Z (lower band) was found on both sides of the brain. (B) Southern blot of genomic DNA from leg muscle (1, right, and 2, left) and feather pulp (3, right, and 4, left) of the gynandromorph shows greater amount of ASW in genomic DNA from the left side than from the right.
Figure 9
Figure 9
Measurement of DNA content of blood cells. Graphs compare the distribution of intensity of propidium iodide labeling of nuclear DNA in populations of blood cells from the gynandromorph and a typical control male and female. Blood DNA content of the gynandromorph was intermediate to control males and females, which suggested the animal was within the diploid range. The male and female plots represent five individuals for each.
Figure 10
Figure 10
Photomicrographs of transverse sections through the syrinx at the level of the pessulus (A–C, bar = 1.0 mm) and higher magnification of ventral muscle fibers (A1–C1, bar = 20 μm). Female control (A), gynandromorph (B), and male control (C). Overall, the thickness of the syringeal muscles and of individual fibers in the gynandromorph was intermediate to that of males and females. The genotype was not determined for the two sides of the syrinx.

References

    1. Arnold A P. In: Hormones, Brain, and Behavior. Pfaff D W, Etgen A, Fahrbach S, Rubin R, editors. Vol. 4. New York: Academic; 2002. pp. 105–135.
    1. Goodfellow P N, Lovell-Badge R. Annu Rev Genet. 1993;27:71–92. - PubMed
    1. Arnold A P, Gorski R A. Annu Rev Neurosci. 1984;7:413–442. - PubMed
    1. Phoenix C, Goy R, Gerall A A, Young W C. Endocrinology. 1959;65:369–382. - PubMed
    1. Nottebohm F, Arnold A P. Science. 1976;194:211–213. - PubMed

Publication types

MeSH terms

Associated data