. 2003 Apr;69(4):2116-25.
doi: 10.1128/AEM.69.4.2116-2125.2003.

Spatial and temporal analysis of the microbial community in slow sand filters used for treating horticultural irrigation water

Affiliations

Spatial and temporal analysis of the microbial community in slow sand filters used for treating horticultural irrigation water

Leo A Calvo-Bado et al. Appl Environ Microbiol. 2003 Apr.

Abstract

An experimental slow sand filter (SSF) was constructed to study the spatial and temporal structure of a bacterial community suppressive to an oomycete plant pathogen, Phytophthora cryptogea. Passage of water through the mature sand column resulted in complete removal of zoospores of the plant pathogen. To monitor global changes in the microbial community, bacterial and fungal numbers were estimated on selective media, direct viable counts of fungal spores were made, and the ATP content was measured. PCR amplification of 16S rRNA genes and denaturing gradient gel electrophoresis (DGGE) were used to study the dynamics of the bacterial community in detail. The top layer (1 cm) of the SSF column was dominated by a variable and active microbial population, whereas the middle (50 cm) and bottom (80 cm) layers were dominated by less active and diverse bacterial populations. The major changes in the microbial populations occurred during the first week of filter operation, and these populations then remained to the end of the study. Spatial and temporal nonlinear mapping of the DGGE bands provided a useful visual representation of the similarities between SSF samples. According to the DGGE profile, less than 2% of the dominating bands present in the SSF column were represented in the culturable population. Sequence analysis of DGGE bands from all depths of the SSF column indicated that a range of bacteria were present, with 16S rRNA gene sequences similar to groups such as Bacillus megaterium, Cytophaga, Desulfovibrio, Legionella, Rhodococcus rhodochrous, Sphingomonas, and an uncharacterized environmental clone. This study describes the characterization of the performance, and microbial composition, of SSFs used for the treatment of water for use in the horticultural industry. Utilization of naturally suppressive population of microorganisms either directly or by manipulation of the environment in an SSF may provide a more reproducible control method for the future.


Figures

FIG. 1.
FIG. 1.
Schematic representation of the SSF used in this study. The water supply system (storage tank), recirculation system (headwater and sump), and filtration system are indicated. Arrows indicate the direction of the water flow. ☼, positions of pumps.
FIG. 2.
FIG. 2.
Dynamics of the microbial community on selective media from the top, middle, and bottom layers of the SSF over a 4-week period. (A) Total bacterial population on 0.1 TSA medium; (B) Pseudomonas population on P1 medium; (C) total fungal population on potato dextrose agar medium; (D) direct counts of fungal spores 4 weeks after loading. Bars represent treatment means (± standard errors), and different letters above the bars indicate that values differed significantly at a P value of <0.05.
FIG. 3.
FIG. 3.
ATP content at top, middle, and bottom layer of the SSF at weeks 2 and 4 after loading. Bars represent treatment means (± standard errors), and different letters above the bars indicate that values differed significantly at a P value of <0.05.
FIG. 4.
FIG. 4.
Ethidium bromide-stained DGGE gel (negative image) showing the 194-bp PCR-amplified fragment of the 16S rRNA genes (V3 region) from a spatial and temporal analysis of the bacterial community from three different depths in the SSF over a 4-week period after loading. Lanes: 1, original sand; 2, 5, and 8, top; 3, 6, and 9, middle; 4, 7, and 10, bottom; 11, storage tank; 12, headwater. Samples were taken in weeks 1 (lanes 2 to 4), 2 (lanes 5 to 7), and 4 (lanes 8 to 10). Lane M represents a bacterial marker containing P. fluorescens (a), S. yanoikuyae (b), B. subtilis (c), B. phenazium (d), P. amyloyticus (e), A. rhizogenes (f), and A. polychromogenes (g). ▸ indicates the DGGE bands selected for cloning and sequencing (SSF-1 to SSF-7). These bands were excised from the gel from the top (SSF-1 and SSF-2) or middle and bottom layers (SSF-3, SSF-4, SSF-5, SSF-6, and SSF-7) of the SSF from samples at week 4.
FIG. 5.
FIG. 5.
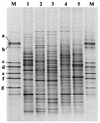
Ethidium bromide-stained DGGE gel (negative image) showing the 194-bp PCR-amplified fragment of the 16S rRNA genes (V3 region) from the storage tank and outflow water over a 4-week period after loading. Lanes: 1 to 3, storage tank; 4 and 5, outflow water. Samples were taken from the storage tank in weeks 1 (lane 1), 2 (lane 2), and 4 (lane 3) and from outflow water in weeks 2 (lane 4) and 4 (lane 5) after loading. Lane M represents a bacterial marker containing P. fluorescens (a), S. yanoikuyae (b), B. subtilis (c), B. phenazium (d), P. amyloyticus (e), A. rhizogenes (f), and A. polychromogenes (g).
FIG. 6.
FIG. 6.
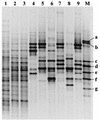
Ethidium bromide-stained DGGE gel (negative image) showing the 194-bp PCR-amplified fragment of the 16S rRNA genes (V3 region) from total and culturable bacterial DNA extracted from three different depths in the SSF in week 4 after loading. Samples were taken from the top (lane 1), middle (lane 2), and bottom (lane 3) of the sand column, and bacterial colonies were grown on 0.1 TSA and P1 media, respectively, from the top (lanes 4 and 5), middle (lanes 6 and 7), and bottom (lanes 8 and 9). Lane M represents a bacterial marker containing P. fluorescens (a), S. yanoikuyae (b), B. subtilis (c), B. phenazium (d), P. amyloyticus (e), A. rhizogenes (f), and A. polychromogenes (g).
FIG. 7.
FIG. 7.
Two-dimensional Sammon map of the DGGE banding patterns from all the SSF runs and their replicate SSF columns (a, b, c, d, and e). Labels represent bacterial communities at the top (T), middle (M), and bottom (B) layers of the SSF at 1, 2, 3, and 4 weeks after loading and original sand (S), storage tank (ST), headwater tank (HW), and outflow water (OFW).
FIG. 8.
FIG. 8.
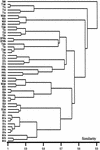
Dendrogram derived from a distance analysis of bands and the UPGMA method of clustering to show relationships between DGGE patterns from all the SSF runs and their replicate SSF columns (a, b, c, d, and e). Labels represent bacterial communities at the top (T), middle (M), and bottom (B) layers of the SSF at 1, 2, 3, and 4 weeks after loading, and original sand (S), storage tank (ST), headwater tank (HW), and outflow water (OFW).

References

    1. Ali-Shtayeh, M. S., and J. D. MacDonald. 1991. Occurrence of Phytophthora species in irrigation water in the Nablus area (West Bank of Jordan). Phytopathol. Mediterr. 30:143-150.
    1. Ali-Shtayeh, M. S., J. D. MacDonald, and J. Kabashima. 1991. A method for using commercial ELISA tests to detect zoospores of Phytophthora and Pythium species in irrigation water. Plant Dis. 75:305-311.
    1. Berkelmann, B., W. Wohanka, and G. Wolf. 1994. Characterisation of the bacterial flora in recirculating nutrient solutions of a hydroponic system with rockwool. Acta Hortic. 361:372-381.
    1. Bewley, W. F., and W. Buddin. 1921. On the fungus flora of glasshouse water supplies in relation to plant disease. Ann. Appl. Biol. 8:10-19.
    1. Bock, C., R. M. Kroppenstedt, and H. Diekmann. 1996. Degradation and bioconversion of aliphatic and aromatic hydrocarbons by Rhodococcus ruber 219. Appl. Microb. Biotechnol. 45:408-410.

Publication types

MeSH terms

LinkOut - more resources