. 2003 Apr;69(4):2253-68.
doi: 10.1128/AEM.69.4.2253-2268.2003.

Bacterioplankton community shifts in an arctic lake correlate with seasonal changes in organic matter source

Affiliations

Bacterioplankton community shifts in an arctic lake correlate with seasonal changes in organic matter source

Byron C Crump et al. Appl Environ Microbiol. 2003 Apr.

Abstract

Seasonal shifts in bacterioplankton community composition in Toolik Lake, a tundra lake on the North Slope of Alaska, were related to shifts in the source (terrestrial versus phytoplankton) and lability of dissolved organic matter (DOM). A shift in community composition, measured by denaturing gradient gel electrophoresis (DGGE) of 16S rRNA genes, occurred at 4 degrees C in near-surface waters beneath seasonal ice and snow cover in spring. This shift was associated with an annual peak in bacterial productivity ([(14)C]leucine incorporation) driven by the large influx of labile terrestrial DOM associated with snow meltwater. A second shift occurred after the flux of terrestrial DOM had ended in early summer as ice left the lake and as the phytoplankton community developed. Bacterioplankton communities were composed of persistent populations present throughout the year and transient populations that appeared and disappeared. Most of the transient populations could be divided into those that were advected into the lake with terrestrial DOM in spring and those that grew up from low concentrations during the development of the phytoplankton community in early summer. Sequencing of DNA in DGGE bands demonstrated that most bands represented single ribotypes and that matching bands from different samples represented identical ribotypes. Bacteria were identified as members of globally distributed freshwater phylogenetic clusters within the alpha- and beta-Proteobacteria, the Cytophaga-Flavobacteria-Bacteroides group, and the ACTINOBACTERIA:


Figures

FIG. 1.
FIG. 1.
Toolik Lake shown with shaded depth contours.
FIG. 2.
FIG. 2.
Discharge rate (solid line) and DOC concentration (dashed line with data points) of water in the primary inlet stream to Toolik Lake.
FIG. 3.
FIG. 3.
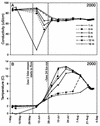
Conductivity (A) and temperature (B) in Toolik Lake in 2000.
FIG. 4.
FIG. 4.
Bacterial production rate in the primary inlet stream (solid triangles), depth-averaged bacterial production rate (solid diamonds), and chlorophyll a concentration (solid circles, dashed line) in Toolik Lake in 2000.
FIG. 5.
FIG. 5.
Bacterial production rate (A) and prokaryotic cell concentration (B) in Toolik Lake and in the primary inlet stream in 2000.
FIG. 6.
FIG. 6.
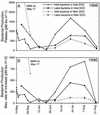
DOC flux via the primary inlet stream (solid line) and bacterial production rate in the inlet stream (solid squares), in Toolik Lake surface waters (open triangles), and in Toolik Lake deep waters (open circles) in 1996.
FIG. 7.
FIG. 7.
Quantity of labile DOC measured as the plateau in bacterial production rate (A) and the maximum rate of increase in bacterial production rate (B) during the bioassay incubations in 1996 for Toolik inlet stream DOC incubated with Toolik inlet bacteria (solid circles) and Toolik Lake bacteria (solid squares) and for tussock tundra weir DOC incubated with Toolik inlet bacteria (open circles) and with Toolik Lake bacteria (open squares). Note that measurements from the tussock tundra stream weir on 17 May 1996 were extremely high and therefore were off the scale of these graphs.
FIG. 8.
FIG. 8.
UPGMA cluster analysis (with bootstrap values, 1,000 replications) (A) and multidimensional scaling analysis (B) (with stress value) of Dice distance matrix calculated from DGGE banding patterns. Brackets in UPGMA analysis and lines and gray circles on multidimensional scaling diagram were added to highlight the seasonal shifts in bacterial community composition as represented by DGGE banding patterns.
FIG. 9.
FIG. 9.
DGGE patterns of the four samples used for DGGE band sequencing. Samples were collected at a depth of 3 m in Toolik Lake. Lines connect bands at the same position in the gel. White X's indicate the presence of a band in a sample. White circles indicate the samples from which the bands were sequenced. Symbols to the right of the lines categorize the sequenced DGGE bands as persistent bands (solid diamonds), bands that appear below the ice in the spring (black X's), bands that disappear below the ice in the spring (open diamonds), bands that appear only after ice leaves the lake (+), and bands that do not fall into these categories (−).
FIG. 10.
FIG. 10.
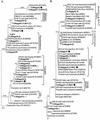
Minimum evolution trees showing the phylogenetic positions of organisms within the Cytophaga-Flavobacterium-Bacteroides group (A), β- and γ-Proteobacteria (B), α-Proteobacteria (C), Actinobacteria (D), and chloroplasts (E). Sequences from this study are in boldface type. Symbols following the sequences indicate whether the DGGE band was persistent (solid diamonds), disappeared below the ice in the spring (open diamonds), appeared below the ice in the spring (X's), or could not be categorized either because it was sequenced from a band containing more than one organism or because it did not fit into one of the previous categories (minus sign). Clusters are named after cultivated organisms or after the name of the longest available 16S rRNA gene sequence from an environmental clone. Parenthetical cluster names are from Glöckner et al. (13).
FIG. 10.
FIG. 10.
Minimum evolution trees showing the phylogenetic positions of organisms within the Cytophaga-Flavobacterium-Bacteroides group (A), β- and γ-Proteobacteria (B), α-Proteobacteria (C), Actinobacteria (D), and chloroplasts (E). Sequences from this study are in boldface type. Symbols following the sequences indicate whether the DGGE band was persistent (solid diamonds), disappeared below the ice in the spring (open diamonds), appeared below the ice in the spring (X's), or could not be categorized either because it was sequenced from a band containing more than one organism or because it did not fit into one of the previous categories (minus sign). Clusters are named after cultivated organisms or after the name of the longest available 16S rRNA gene sequence from an environmental clone. Parenthetical cluster names are from Glöckner et al. (13).

Similar articles

Cited by

References

    1. Bahr, M., J. E. Hobbie, and M. L. Sogin. 1996. Bacterial diversity in an Arctic lake: a freshwater SAR11 cluster. Aquat. Microb. Ecol. 11:271-277.
    1. Bergström A.-K., and M. Jansson. 2000. Bacterioplankton production in humic Lake Örträsket in relation to input of bacterial cells and input of allochthonous organic carbon. Microb. Ecol. 39:101-115. - PubMed
    1. Castberg, T., A. Larsen, R. A. Sandaa, C. P. D. Brussaard, J. K. Egge, M. Heldal, R. Thyrhaug, E. J. van Hannen, and G. Bratbak. 2001. Microbial population dynamics and diversity during a bloom of marine coccolithophorid Emiliania huxleyi (Haptophyta). Mar. Ecol. Prog. Ser. 221:39-46.
    1. Cole, J. J., S. Findlay, and M. L. Pace. 1988. Bacterial production in fresh and saltwater ecosystems: a cross-system overview. Mar. Ecol. Prog. Ser. 43:1-10.
    1. Crump, B. C., E. V. Armbrust, and J. A. Baross. 1999. Phylogenetic analysis of particle-attached and free-living bacterial communities in the Columbia River, its estuary, and the adjacent coastal ocean. Appl. Environ. Microbiol. 65:3192-3204. - PMC - PubMed

Publication types

Associated data

LinkOut - more resources