. 2003 Apr;69(4):2340-8.
doi: 10.1128/AEM.69.4.2340-2348.2003.

A new rate law describing microbial respiration

Affiliations

A new rate law describing microbial respiration

Qusheng Jin et al. Appl Environ Microbiol. 2003 Apr.

Abstract

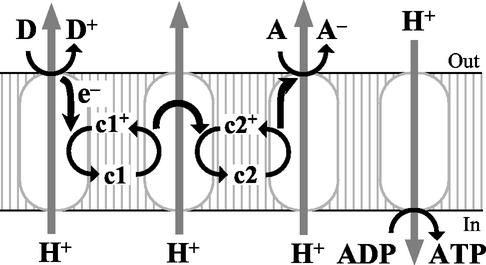
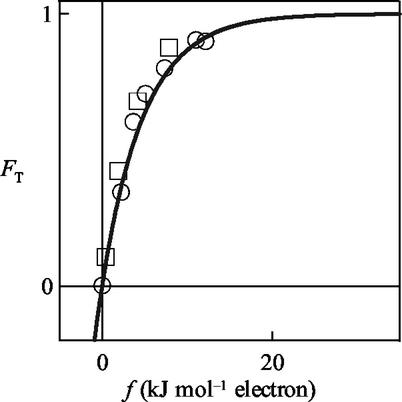
The rate of microbial respiration can be described by a rate law that gives the respiration rate as the product of a rate constant, biomass concentration, and three terms: one describing the kinetics of the electron-donating reaction, one for the kinetics of the electron-accepting reaction, and a thermodynamic term accounting for the energy available in the microbe's environment. The rate law, derived on the basis of chemiosmotic theory and nonlinear thermodynamics, is unique in that it accounts for both forward and reverse fluxes through the electron transport chain. Our analysis demonstrates how a microbe's respiration rate depends on the thermodynamic driving force, i.e., the net difference between the energy available from the environment and energy conserved as ATP. The rate laws commonly applied in microbiology, such as the Monod equation, are specific simplifications of the general law presented. The new rate law is significant because it affords the possibility of extrapolating in a rigorous manner from laboratory experiment to a broad range of natural conditions, including microbial growth where only limited energy is available. The rate law also provides a new explanation of threshold phenomena, which may reflect a thermodynamic equilibrium where the energy released by electron transfer balances that conserved by ADP phosphorylation.


Figures

FIG. 1.
FIG. 1.
Generalized pathway of microbial respiration (13). Electrons derived from a donating species, D, are transferred through the respiratory chain containing three redox enzymes and two coenzymes, c1 and c2, to an accepting species, A. Energy liberated is conserved by translocating protons out of membrane, building up a proton motive force. The proton motive force is consumed by a proton-translocating ATP synthase to produce ATP from ADP. Reaction centers (ovals) are, from left to right, three redox enzymes and the ATP synthase.
FIG. 2.
FIG. 2.
Relationship between the thermodynamic driving force, f, and the thermodynamic potential factor, FT, for electron transfer through mitochondrial respiratory chain (13), as reported by Rottenberg and Gutman (; their Fig. 3). Data points are FT, estimated as the ratio of the observed electron transfer rate, ν, relative to the observed or extrapolated highest rate (i.e., νmax × FD × FA). The thermodynamic driving force is estimated by equation 6, using reported concentrations of chemical species. The solid line is FT predicted by equation 11 at various thermodynamic driving forces, calculated using an average stoichiometric number, χ, per electron transferred of 2. Symbols: □ constant ΔG of −27.5 kJ per mol of electrons; ○, constant ΔG of −30.2 kJ per mol of electrons.
FIG. 3.
FIG. 3.
Comparison of benzoate degradation by Pseudomonas sp., as observed in experiments conducted by Simkins and Alexander (31), with predictions of the new rate law. The initial benzoate concentrations, C0, are 100, 32, 10, 3.2, 1.0, 0.32, 0.1, 0.03, and 0.01 μg ml−1, as labeled for each line. Benzoate concentration (lines) is predicted for each experiment by integrating equation 24, as described in the text.
FIG. 4.
FIG. 4.
Results of an experimental study of arsenate reduction by B. arsenicoselenatis, as reported by Blum et al. (; their Fig. 4). The plot on the left shows concentrations of species in the electron-donating reaction, and the plot on the right shows those of species in the electron-accepting reaction. Lines are species concentrations predicted by integrating equation 31, using equation 17 to describe biomass growth, as described in the text.
FIG. 5.
FIG. 5.
Concentration of B. arsenicoselenatis biomass (symbols) in the experiment reported by Blum et al. (; their Fig. 4). The line is biomass predicted by the rate law integration shown in Fig. 4.
FIG. 6.
FIG. 6.
Kinetic factors, FD and FA, the thermodynamic potential factor, FT, and the resulting reaction rate, ν, in the rate law integration shown in Fig. 4 and 5. FD and FA are calculated from equations 28 and 30, and FT is calculated from equation 26; ν is the product of the rate constant, k, biomass, [X] (Fig. 5), and the values of FD, FA, and FT.

References

    1. Bae, W., and B. E. Rittmann. 1996. A stuctured model of dual-limitation kinetics. Biotechnol. Bioeng. 49:683-689. - PubMed
    1. Bekins, B. A., E. Warren, and E. M. Godsy. 1998. A comparision of zero-order, first-order, and Monod biotransformation models. Ground Water 36:261-268.
    1. Bethke, C. M. 1996. Geochemical reaction modeling. Oxford University Press, New York, N.Y.
    1. Bethke, C. M. 2002. The geochemist's workbench, release 4.0. University of Illinois, Urbana.
    1. Blum, J. S., A. B. Bindi, J. Buzzelli, J. F. Stolz, and R. S. Oremland. 1998. Bacillus arsenicoselenatis, sp. nov., and Bacillus selenitireducens, sp. nov.: two haloalkaliphiles from Mono Lake, California, that respire oxyanions of selenium and arsenic. Arch. Microbiol. 171:19-30. - PubMed

LinkOut - more resources