. 2003 Jun 1;549(Pt 2):501-12.
doi: 10.1113/jphysiol.2003.042416. Epub 2003 Apr 4.

Glycogen regulation and functional role in mouse white matter

Affiliations

Glycogen regulation and functional role in mouse white matter

Angus M Brown et al. J Physiol. .

Abstract

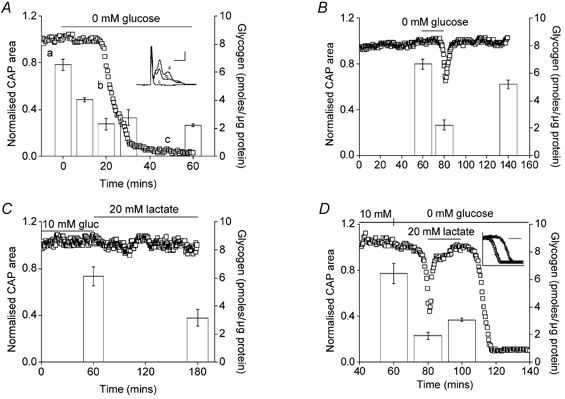
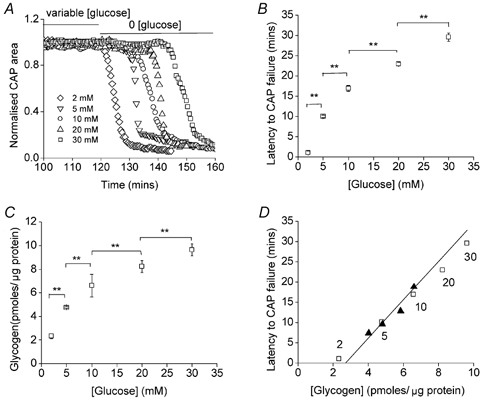
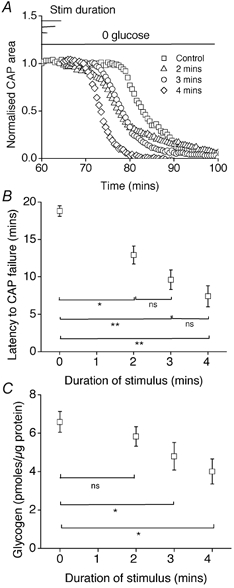
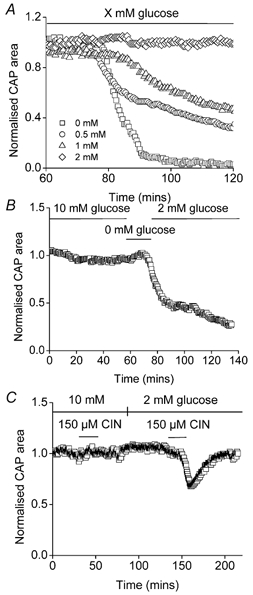
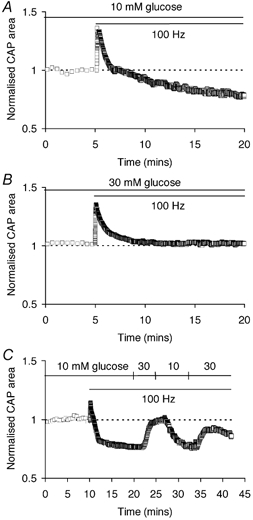
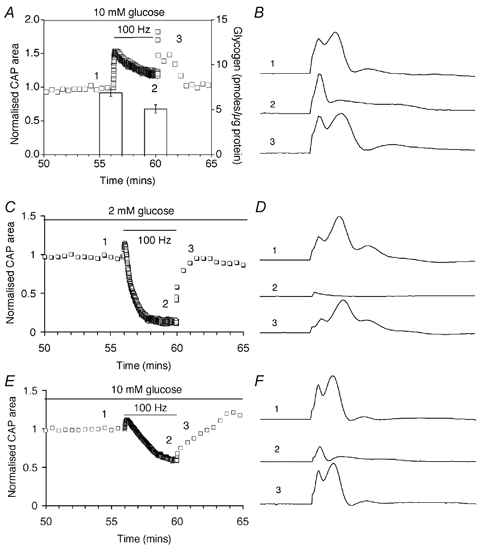
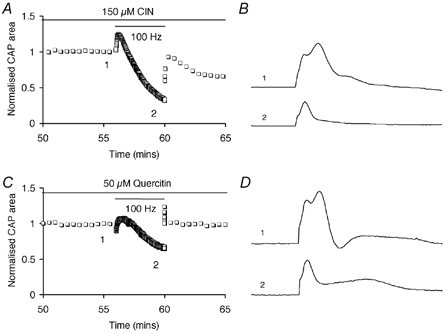
CNS glycogen, contained predominantly in astrocytes, can be converted to a monocarboxylate and transported to axons as an energy source during aglycaemia. We analysed glycogen regulation and the role of glycogen in supporting neural activity in adult mouse optic nerve, a favourable white matter preparation. Axon function was quantified by measuring the compound action potential (CAP) area. During aglycaemia, axon function persisted for 20 min, then declined in conjunction with glycogen content. Lactate fully supported CAPs in the absence of glucose, but was unable to sustain glycogen content; thus, axon failure occurred rapidly when lactate was withdrawn. Glycogen content in the steady state was directly proportional to bath glucose concentration. Increasing [K+]o to 10 mM caused a rapid decrease in glycogen content. Latency to onset of CAP failure during aglycaemia was directly proportional to glycogen content and varied from about 2 to 30 min. Intense neural activity reduced glycogen content in the presence of 10 mM bath glucose and CAP area gradually declined. CAP area declined more rapidly during high frequency stimulation if monocarboxylate transport was inhibited. This suggested that astrocytic glycogen was broken down to a monocarboxylate(s) that was used by rapidly discharging axons. Likewise, depleting glycogen by brief periods of high frequency axon stimulation accelerated onset of CAP decline during aglycaemia. In summary, these experiments indicated that glycogen content was under dynamic control and that glycogen was used to support the energy needs of CNS axons during both physiological as well as pathological processes.


Figures

Figure 1
Figure 1. MON function and glycogen content
A, aglycaemia resulted in onset of failure of the CAP after 17.8 ± 1.6 min (n = 4). The inset shows representative CAPs recorded from one of the nerves averaged in A at the indicated time points (a-c; calibration 0.5 mV, 1 ms). Prior to aglycaemia, the glycogen content was 6.52 ± 0.40 pmol glycogen (μg protein)−1 (n = 3). Glycogen fell to 4.40 ± 0.13 pmol glycogen (μg protein)−1 after 10 min of glucose deprivation (n = 3; P < 0.01vs. 0 min group) and to 2.30 ± 0.41 pmol glycogen (μg protein)−1 (n = 3; P < 0.01vs. 10 min group; P < 0.01vs. 0 min group) after 20 min of glucose deprivation and remained roughly at this latter value in spite of continuing aglycaemia (30 and 60 min, 2.77 ± 0.53 and 2.22 ± 0.09 pmol glycogen (μg protein)−1, respectively; n = 3, P < 0.001vs. 0 min group). Subsequent recovery in control aCSF had no significant effect on glycogen content (2.87 ± 0.12 pmol glycogen (μg protein)−1; n = 3; n.s. vs. 60 min group; data not shown); ANOVA with Tukey's post hoc test. B, glucose-free aCSF for 20 min led to fully reversible CAP reduction and loss of glycogen. Function was fully restored by 10 mm glucose (n = 3). The glycogen content of nerves after 1 h of incubation in 10 mm glucose was 6.66 ± 0.36 pmol glycogen (μg protein)−1 (n = 3), which fell to 2.22 ± 0.38 pmol glycogen (μg protein)−1 (n = 3; P < 0.01 compared with 60 min) after 20 min of aglycaemia. Glycogen content was significantly restored after 1 h recovery in 10 mm glucose aCSF (5.18 ± 0.32 pmol glycogen (μg protein)−1, n = 3; P < 0.05 compared with 80 min). The difference between the glycogen content at 60 and 140 min was not significant (P > 0.05; ANOVA with Tukey's post hoc test). C, bath lactate (120 min) sustained CAP amplitude (n = 3), but not glycogen content, which fell significantly when incubated in 20 mm lactate for 2 h (6.13 ± 0.66 to 3.14 ± 0.60 pmol glycogen (μg protein)−1, n = 3; P < 0.05; Student's t test). D, glycogen was depleted by exposure to 20 min of aglycaemia (6.44 ± 0.73 to 1.92 ± 0.27 pmol glycogen (μg protein)−1, n = 3; P < 0.01). CAP function, but not glycogen (3.05 ± 0.20 compared with 1.92 ± 0.27 pmol glycogen (μg protein)−1, n = 3, n.s.), was restored by 20 mm lactate aCSF; ANOVA with Tukey's post hoc test. Lactate withdrawal now resulted in rapid CAP failure (n = 3). The inset illustrates the accelerated CAP failure after glycogen depletion (open triangles) compared with control where MONs were bathed in 10 mm glucose for 100 min (open squares; latency to CAP failure = 19.5 ± 2.2 vs. 8.5 ± 1.7 min, P < 0.01, n = 3; Student's t test). The scale bar is 10 min and the x axis starts at onset of aglycaemia. For A-D the left axis indicates average CAP area (open squares) and the right axis indicates the glycogen content of the nerve (open columns). Error bars indicate the s.e.m.
Figure 2
Figure 2. Effects of pre-incubation glucose concentration on glycogen content and latency to CAP failure during aglycaemia
A and B, nerves bathed for 2 h in 2, 5, 10, 20 or 30 mm glucose had latencies to CAP failure of 1.0 ± 0.5 min (n = 3), 10.1 ± 0.3 min (n = 3; P < 0.001vs. 2 mm), 16.9 ± 0.8 min (n = 3; P < 0.001vs. 5 mm), 23.0 ± 0.5 min (n = 3; P < 0.001vs. 10 mm) and 29.6 ± 1.1 min (n = 3; P < 0.001vs. 20 mm), respectively (** indicates P < 0.001); ANOVA with Tukey's post hoc test. C, nerves bathed for 2 h in 2, 5, 10, 20 or 30 mm glucose had glycogen content of 2.34 ± 0.25 pmol glycogen (μg protein)−1 (n = 3), 4.77 ± 0.10 pmol glycogen (μg protein)−1 (n = 3; P < 0.001vs. 2 mm), 6.57 ± 0.23 pmol glycogen (μg protein)−1 (n = 3; P < 0.001vs. 5 mm), 8.23 ± 0.49 pmol glycogen (μg protein)−1 (n = 3; P < 0.001vs. 10 mm) and 9.63 ± 0.50 pmol glycogen (μg protein)−1 (n = 3; P < 0.001vs. 20 mm), respectively (** indicates P < 0.001); ANOVA with Tukey's post hoc test. D, straight line shows calculated relationship between the latency to onset of CAP failure during aglycaemia and glycogen content (see text for details). Open squares indicate actual data points from B and C, and numbers by the squares indicate pre-incubation glucose concentrations. Filled triangles indicate the data from Fig. 7B and C (see text). Error bars in B and C indicate the s.e.m.
Figure 7
Figure 7. High frequency axonal discharge depleted glycogen content and accelerated CAP failure during aglycaemia
A and B, the latency to CAP failure in the control group was 18.8 ± 0.7 min (n = 4). With 100 Hz stimulation for 2, 3 or 4 min, latency to onset of CAP failure was 12.9 ± 1.2 min (n = 4; P < 0.05vs. control), 9.6 ± 1.3 min (n = 4; P < 0.001vs. control; vs. 2 min n.s.) and 7.4 ± 1.4 min (n = 4; P < 0.001vs. control; vs. 3 min n.s.), respectively (* indicates P < 0.05; ** indicates P < 0.001); ANOVA with Tukey's post hoc test. C, under control conditions, at the onset of aglycaemia, the glycogen content was 6.59 ± 0.54 (n = 3). Glycogen content immediately following 2, 3 or 4 min of 100 Hz stimulation was 5.83 ± 0.51 (n = 3), 4.80 ± 0.72 (n = 3) or 4.01 ± 0.65 pmol glycogen (μg protein)−1 (n = 3), respectively. The 3 and 4 min periods of stimulation produced statistically significant reductions in glycogen (P < 0.05) compared with control, (n = 3 for each condition; * indicates P < 0.05); ANOVA with Tukey's post hoc test. Error bars in B and C indicate the s.e.m.
Figure 3
Figure 3. Ambient glucose concentration and MON function
A, glucose concentrations between 0 and 2 mm were tested for their ability to sustain MON function measured as the CAP. A glucose concentration of 2 mm supported axon function for at least 120 min (n = 3). Lower glucose concentrations were unable to fully support axon function (1 mm, n = 3; 0.5 mm, n = 6; 0 mm, n = 4). B, prior incubation in 0 mm glucose for 20 min rendered 2 mm glucose ineffective to maintain axon function (n = 3). C, the monocarboxylate transport inhibitor CIN (150 μm) had no effect on CAP area in 10 mm glucose, but reversibly depressed CAP area in 2 mm glucose (n = 3).
Figure 4
Figure 4. CAP area is affected by substrate availability during high frequency stimulation
A, CAP area gradually declined during extended 100 Hz stimulation in 10 mm glucose. B, in 30 mm glucose CAP area showed an initial increase but quickly stabilised during 100 Hz stimulation. C, CAP area varied reversibly during 100 Hz stimulation when glucose concentration was switched repeatedly between 10 and 30 mm.
Figure 5
Figure 5. High frequency axon discharge and glycogen in the MON
A, CAP area (open squares, left axis) during a 4 min period of 100 Hz stimulation in 10 mm glucose. Note that CAP area does not decline. Glycogen content (columns, right axis) decreased from 6.86 ± 0.39 to 5.08 ± 0.45 pmol glycogen (μg protein)−1 (n = 3; P < 0.05; Student's t test) B, representative CAPs recorded from one of the nerves averaged in A at the indicated time points (1–3). CAP shape changes considerably during high frequency stimulation and recovery. C, CAP area fell rapidly during 100 Hz stimulation in nerves perfused in 2 mm glucose for 1 h. D, representative CAPs recorded from one of the nerves averaged in C at the indicated time points (1–3). E, CAP area fell during high frequency stimulation in nerves perfused with 10 mm glucose when glycogen content was depleted by prior aglycaemia (for 15 min; i.e. minute ‘35 to 50′). F, representative CAPs recorded from one of the nerves averaged in E at the indicated time points (1–3). Error bars in A indicate the s.e.m.
Figure 6
Figure 6. Monocarboxylate transport blockers and CAP area
A, the MCT blocker cinnamic acid (CIN) caused CAP area to decline during stimulation in 10 mm glucose. Control CAP area (0.94 ± 0.04, n = 4) vs. area after stimulation (0.41 ± 0.03, n = 4) was significantly different (P < 0.0001; Student's t test). B, representative CAPs recorded from one of the nerves averaged in A at the two indicated time points. C, the MCT blocker quercitin caused CAP area to decline during stimulation in 10 mm glucose. Control CAP area (1.01 ± 0.03, n = 3) vs. area after stimulation (0.65 ± 0.05, n = 3) was significantly different (P < 0.005; Student's t test). D, representative CAPs recorded from one of the nerves averaged in C at the two indicated time points. These results indicate that lactate transport into axons was required to fully support function during intense activity, even in the presence of glucose.

References

    1. Baltan Tekkök S, Brown AM, Ransom BR. Persistence of axonal function during anoxic insult in mouse optic nerve. Glia. 2002;38(suppl. 1):245.
    1. Belt JA, Thomas JA, Buchsbaum RN, Racker E. Inhibition of lactate transport and glycolysis in Ehrlich ascites tumor cells by bioflavonoids. Biochemistry. 1979;18:3506–3511. - PubMed
    1. Broer S, Broer A, Schneider HP, Stegen C, Halestrap AP, Deitmer JW. Characterization of the high-affinity monocarboxylate transporter MCT2 in Xenopus laevis oocytes. Biochem J. 1999;341:529–535. - PMC - PubMed
    1. Brown AM. A step-by-step guide to non-linear regression analysis of experimental data using a Microsoft Excel spreadsheet. Comp Meth Prog Biomed. 2001;65:191–200. - PubMed
    1. Brown AM, Ransom BR. Astrocytic glycogen maintains axon function during periods of hypoglycaemia in central white matter. JPhysiol. 2001;536.P:118P.

Publication types

LinkOut - more resources