Modeling the early stages of vascular network assembly
- PMID: 12682010
- PMCID: PMC154468
- DOI: 10.1093/emboj/cdg176
Modeling the early stages of vascular network assembly
Abstract
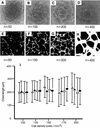
In vertebrates, networks of capillary vessels supply tissues with nutrients. Capillary patterns are closely mimicked by endothelial cells cultured on basement membrane proteins that allow single randomly dispersed cells to self-organize into vascular networks. Here we provide a model including chemoattraction as the fundamental mechanism for cell-to-cell communication in order to identify key parameters in the complexity of the formation of vascular patterns. By flanking biological experiments, theoretical insights and numerical simulations, we provide strong evidence that endothelial cell number and the range of activity of a chemoattractant factor regulate vascular network formation and size. We propose a mechanism linking the scale of formed endothelial structures to the range of cell-to-cell interaction mediated by the release of chemoattractants.
Figures


Similar articles
-
Reorganization of basement membrane matrices by cellular traction promotes the formation of cellular networks in vitro.Lab Invest. 1992 May;66(5):536-47. Lab Invest. 1992. PMID: 1374138
-
Cell directional persistence [corrected] and chemotaxis in vascular morphogenesis.Bull Math Biol. 2004 Nov;66(6):1851-73. doi: 10.1016/j.bulm.2004.04.004. Bull Math Biol. 2004. PMID: 15522357
-
Role of repulsive factors in vascularization dynamics.Phys Rev E Stat Nonlin Soft Matter Phys. 2006 Apr;73(4 Pt 1):041917. doi: 10.1103/PhysRevE.73.041917. Epub 2006 Apr 14. Phys Rev E Stat Nonlin Soft Matter Phys. 2006. PMID: 16711846
-
Introduction: a brief history of capillaries and some examples of their apparently strange behaviour.Clin Exp Pharmacol Physiol. 2000 Oct;27(10):821-5. doi: 10.1046/j.1440-1681.2000.03339.x. Clin Exp Pharmacol Physiol. 2000. PMID: 11022976 Review.
-
Growth factors in endothelial regeneration.Cardiovasc Res. 1993 Jul;27(7):1162-72. doi: 10.1093/cvr/27.7.1162. Cardiovasc Res. 1993. PMID: 8252574 Review. No abstract available.
Cited by
-
Pharmacokinetics and pharmacodynamics of VEGF-neutralizing antibodies.BMC Syst Biol. 2011 Nov 21;5:193. doi: 10.1186/1752-0509-5-193. BMC Syst Biol. 2011. PMID: 22104283 Free PMC article.
-
Human neural stem cell-induced endothelial morphogenesis requires autocrine/paracrine and juxtacrine signaling.Sci Rep. 2016 Jul 4;6:29029. doi: 10.1038/srep29029. Sci Rep. 2016. PMID: 27374240 Free PMC article.
-
A three-dimensional model with two-body interactions for endothelial cells in angiogenesis.Sci Rep. 2023 Nov 23;13(1):20549. doi: 10.1038/s41598-023-47911-1. Sci Rep. 2023. PMID: 37996513 Free PMC article.
-
Thermodynamic Signatures of Structural Transitions and Dissociation of Charged Colloidal Clusters: A Parallel Tempering Monte Carlo Study.Molecules. 2022 Apr 16;27(8):2581. doi: 10.3390/molecules27082581. Molecules. 2022. PMID: 35458778 Free PMC article.
-
Early embryonic vascular patterning by matrix-mediated paracrine signalling: a mathematical model study.PLoS One. 2011;6(9):e24175. doi: 10.1371/journal.pone.0024175. Epub 2011 Sep 19. PLoS One. 2011. PMID: 21949696 Free PMC article.
References
-
- Ben-Jacob E., Cohen,I. and Gutnick,D.L. (1998) Cooperative organization of bacterial colonies: from genotype to morphotype. Annu. Rev. Microbiol., 52, 779–806. - PubMed
-
- Bussolino F., Mantovani,A. and Persico,G. (1997) Molecular mechanisms of blood vessel formation. Trends Biochem. Sci., 22, 251–256. - PubMed
Publication types
MeSH terms
Substances
LinkOut - more resources
Full Text Sources
Other Literature Sources

