. 2003 Apr 15;22(8):1835-45.
doi: 10.1093/emboj/cdg182.

Structure of the GCM domain-DNA complex: a DNA-binding domain with a novel fold and mode of target site recognition

Affiliations

Structure of the GCM domain-DNA complex: a DNA-binding domain with a novel fold and mode of target site recognition

Serge X Cohen et al. EMBO J. .

Abstract

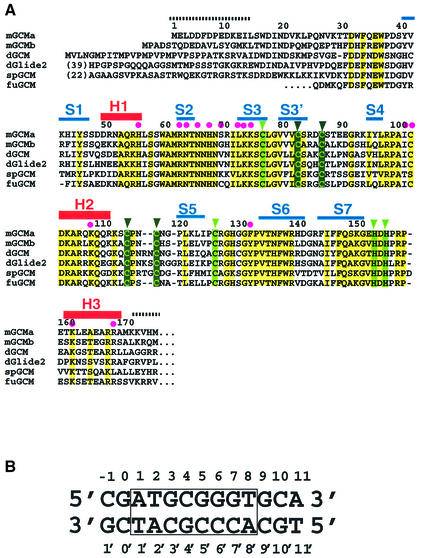
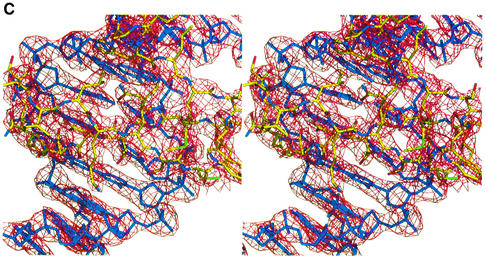
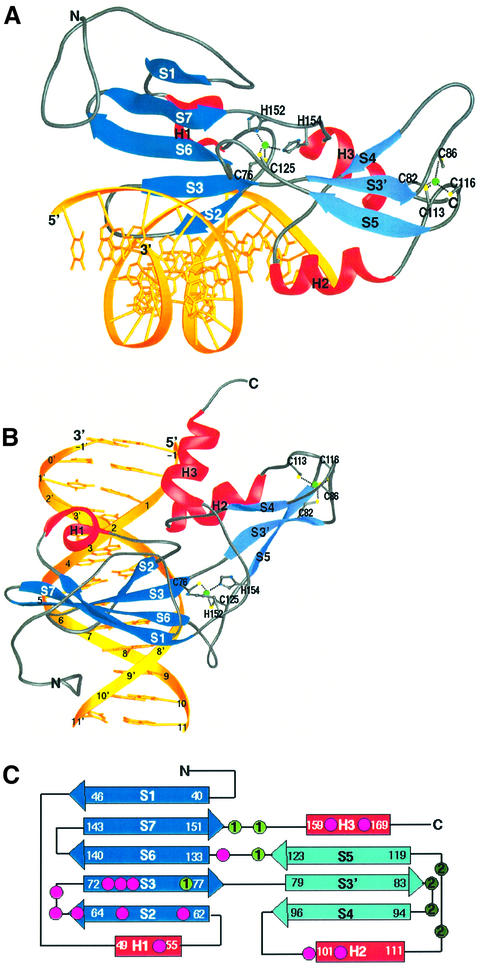
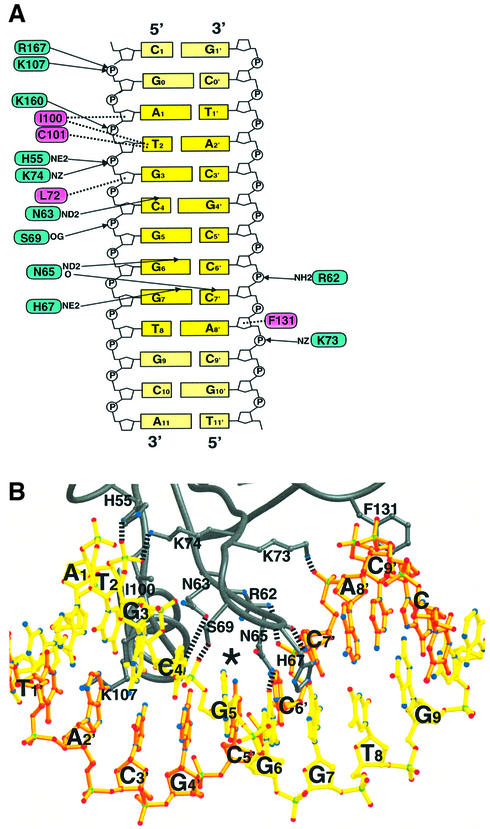
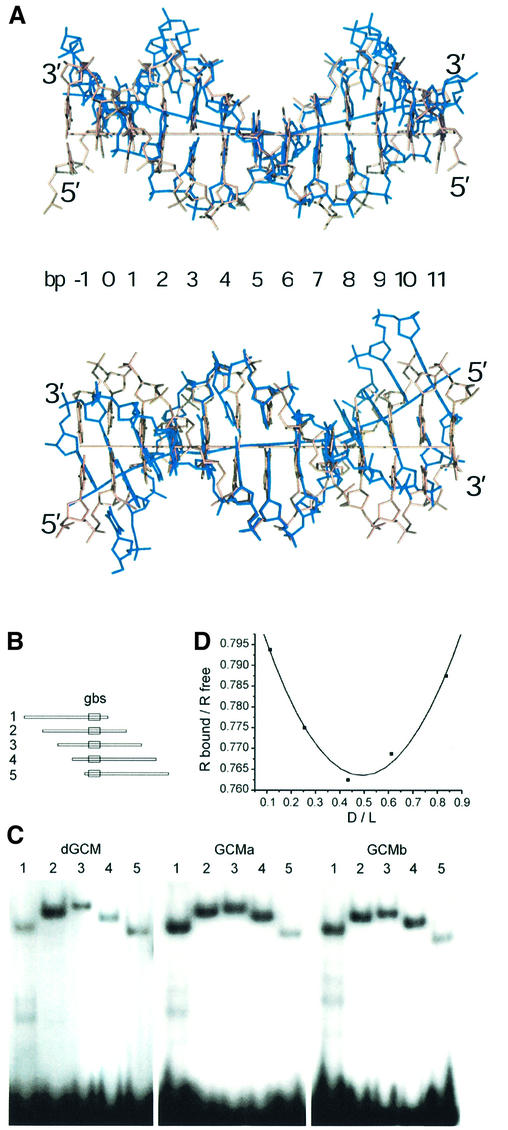
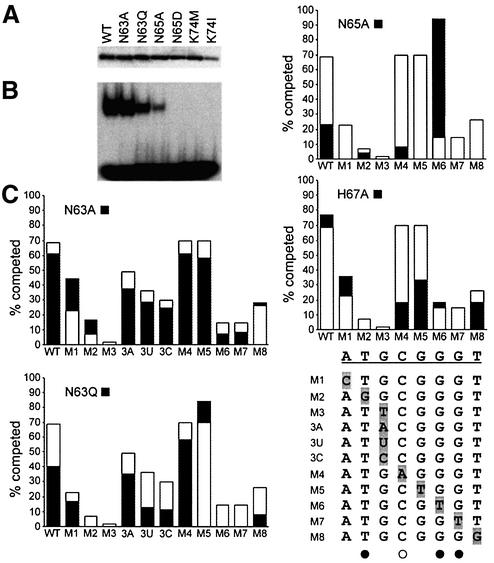
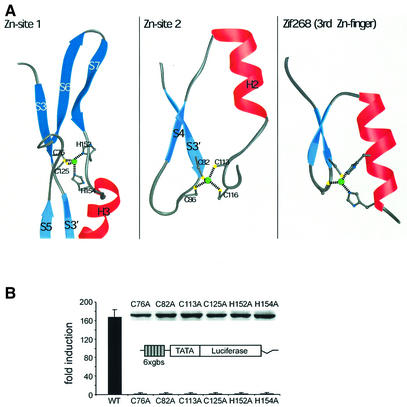
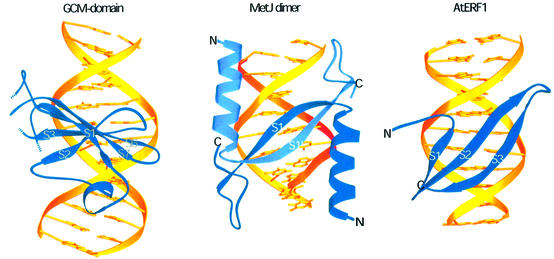
Glia cell missing (GCM) transcription factors form a small family of transcriptional regulators in metazoans. The prototypical Drosophila GCM protein directs the differentiation of neuron precursor cells into glia cells, whereas mammalian GCM proteins are involved in placenta and parathyroid development. GCM proteins share a highly conserved 150 amino acid residue region responsible for DNA binding, known as the GCM domain. Here we present the crystal structure of the GCM domain from murine GCMa bound to its octameric DNA target site at 2.85 A resolution. The GCM domain exhibits a novel fold consisting of two domains tethered together by one of two structural Zn ions. We observe the novel use of a beta-sheet in DNA recognition, whereby a five- stranded beta-sheet protrudes into the major groove perpendicular to the DNA axis. The structure combined with mutational analysis of the target site and of DNA-contacting residues provides insight into DNA recognition by this new type of Zn-containing DNA-binding domain.


Figures

None
Fig. 1. (A) Alignment of the GCM domains from mouse (mGCMa, mGCMb), Drosophila melanogaster (dGCM, dGlide2), sea urchin (spGCM) (Ransick et al., 2002) and the pufferfish fugu (fuGCM). Conserved residues and conservatively substituted residues are drawn on a yellow background. Secondary structure elements are shown above the mGCMa sequence. Regions indicated by broken lines are disordered and have not been included in the final model. Magenta dots indicate DNA-contacting residues; light green and dark green triangles indicate residues coordinating the first and second Zn ions, respectively. (B) Sequence of the 13mer DNA duplex present in crystal forms A and A′. The octameric target site is numbered from 1 to 8 (1′ to 8′ for the opposite strand) and boxed. Flanking base pairs upstream and downstream of the target site are numbered –1 to 0 and 9 to 11, respectively. (C) Stereo diagram of the final 2FoFc electron density map contoured at 1.5σ. Strands S2 and S3 and the contacted DNA target site are shown. The figure was produced using the program BOBSCRIPT (Esnouf, 1999).
None
Fig. 2. Structure of the GCM domain. (A) Ribbon representation of the GCM domain bound to its cognate DNA. The β-sheets of the large and small domains are depicted in dark blue and light blue, respectively. Helices H1, H2 and H3 are shown in red, and the DNA is shown in yellow. The two Zn ions and their coordinating ligands are depicted. Figures 2A and B, 3B, 4A and 6 were produced using the program RIBBONS (Carson, 1991). (B) View of the GCM domain with the DNA axis running vertically. DNA bases are numbered according to Figure 1B. (C) Topology diagram of the GCM domain. DNA-contacting residues and the first and second Zn ion coordinating residues are marked as dots. The color code corresponds to Figures 1A and 2A.
None
Fig. 3. DNA recognition by the GCM domain. (A) Protein–DNA interactions between the GCM domain and its DNA target site. Arrows and dotted lines indicate polar and hydrophobic interactions, respectively. Residues involved in polar and hydrophobic interactions are drawn on blue and magenta backgrounds, respectively. (B) Ribbon representation of the interactions between the GCM domain and its DNA target site Upper and lower strands as shown in Figure 1B are depicted in yellow and orange, respectively. Broken lines indicate polar interactions.
None
Fig. 4. DNA bending observed in the GCM domain–DNA complex. (A) Two orthogonal views of the 13mer DNA duplex in the GCM domain–DNA complex superimposed with canonical B-form DNA. Strands of the GCM-bound DNA are colored in blue. Helical axes were calculated using the program CURVES (Lavery and Sklenar, 1988). (B) The consensus GCM binding site (gbs) was inserted between the XbaI and SalI sites of pBEND2 (Kim et al., 1989) and retrieved with flanking sequences using the restriction enzymes BglII (1), XhoI (2), XmaI (3), Asp718 (4) and BamHI (5). This generates fragments of identical size with circular permutations of the same sequence and the GCM binding site at varying positions. (C) Circular permutation analyses of DNA bending by electrophoretic mobility shift assays with fragments 1–5 from (A) as probes and the GCM domains of Drosophila GCM (dGCM), mouse GCMa (GCMa) and mouse GCMb (GCMb) expressed in transiently transfected COS cells. (D) Calculation of bending angle for GCMa as described previously (Scaffidi and Bianchi, 2001). The mobility of the protein–DNA complexes (Rbound) was normalized to the mobility of the corresponding free probe (Rfree). The distance of the center of the GCM binding site from the 5′ end of the fragment was divided by the total length of the probe (flexure displacement D/L). The plotted points were interpolated with quadratic functions y = 0.207x2 – 0.203x + 0.813 (r2 = 0.987). The first- and second-order parameters are in close agreement and yield an estimate of 37° for the flexure angle. Similar calculations lead to flexure angles of 34° for Drosophila GCM and 35° for GCMb.
None
Fig. 5. DNA-binding properties of mutant GCM domains. (A) Expres sion of T7-epitope tagged wild-type (WT) and mutant (N63A, N63Q, N65A, N65D, K74M, K74I) GCM domains was verified by western blot of nuclear extracts from transfected COS cells with a monoclonal antibody against the tag. (B) Electrophoretic mobility shift assay with the consensus GCM binding site as probe and extracts from transfected COS cells expressing the wild-type and mutant GCM domains. Equal amounts of each GCM domain were used. (C) Comparative DNA- binding analysis of wild-type GCMa and GCM protein mutants by competition analyses. Electrophoretic mobility shift assays were performed with the consensus GCM binding site as probe and extracts expressing the wild-type and mutant GCM protein in the absence and presence of increasing amounts of competitor (5-, 10-, 25-, 50- and 100-fold molar excess). Oligonucleotides containing the consensus GCM binding site (WT) and its variants (M1–M8, 3A, 3U, 3C) were used as competitors. Conditions were such that in the absence of competitor, 20–30% of the radioactively labeled probe was in complex with the GCM domain. The competitor-dependent reduction of probe in the complex was determined by phosphoimager analysis. The graph summarizes the relative level of competition obtained with a 10-fold excess of each competitor (WT, M1–M8, 3A, 3U, 3C) for wild-type GCMa (open bars) and GCM mutants (black bars). WT and mutant target sites (M1–M8, 3A, 3U, 3C) are listed. Directly and indirectly contacted bases as observed in the crystal structure are marked with filled and open circles, respectively.
None
Fig. 6. Structural and functional roles of the Zn ions in the GCM domain. (A) Topology of the two Zn-sites observed in the GCM domain. Note the similar topology of Zn-site 2 (center) and classical Cys2His2 Zn-fingers (right) as present in Zif268 (Elrod-Erickson et al., 1996). (B) Transcriptional activities of mutant GCM proteins. A luciferase reporter plasmid carrying six tandemly arranged GCM-binding sites (6× gbs luc) was transfected into 293 cells together with pCMV5 expression plasmids for wild-type mGCMa (WT) or various mutant versions [Cys76 to Ala (C76A), Cys82 to Ala (C82A), Cys113 to Ala (C113A), Cys125 to Ala (C125A), His152 to Ala (H152A) and His154 to Ala (H154A)]. Luciferase activities in extracts from transfected cells were determined in three independent experiments, each performed in duplicate. Data are presented as fold inductions, which were calculated for each reporter plasmid by comparing luciferase activities with values from cells transfected with reporter plasmid and empty pCMV5 expression plasmid. Expression of wild-type mGCMa and its mutants in transfected cells was confirmed by western blot analysis using a polyclonal antiserum against mGCMa (see inset).
None
Fig. 7. Comparison with other DNA-binding domains. Different use of β-sheets for DNA recognition in the major groove by the GCM domain compared with the bacterial repressor MetJ (Somers and Phillips, 1992) and the A.thaliana transcription factor AtERF1 (Allen et al., 1998).

Similar articles

Cited by

References

    1. Akiyama Y., Hosoya,T., Poole,A.M. and Hotta,Y. (1996) The gcm-motif: a novel DNA-binding motif conserved in Drosophila and mammals. Proc. Natl Acad. Sci. USA, 93, 14912–14916. - PMC - PubMed
    1. Akiyama-Oda Y., Hotta,Y., Tsukita,S. and Oda,H. (2000) Mechanism of glia-neuron cell-fate switch in the Drosophila thoracic neuroblast 6-4 lineage. Development, 127, 3513–3522. - PubMed
    1. Allen M.D., Yamasaki,K., Ohme-Takagi,M., Tateno,M. and Suzuki,M. (1998) A novel mode of DNA recognition by a β-sheet revealed by the solution structure of the GCC-box binding domain in complex with DNA. EMBO J., 17, 5484–5496. - PMC - PubMed
    1. Anson-Cartwright L., Dawson,K., Holmyard,D., Fisher,S.J., Lazzarini,R.A. and Cross,J.C. (2000) The glial cells missing-1 protein is essential for branching morphogenesis in the chorioallantoic placenta. Nat. Genet., 25, 311–314. - PubMed
    1. Berg J.M. and Shi,Y. (1996) The galvanization of biology: a growing appreciation for the roles of zinc. Science, 271, 1081–1085. - PubMed

Publication types

MeSH terms

Associated data