. 2003 Apr 14;161(1):169-86.
doi: 10.1083/jcb.200210110. Epub 2003 Apr 7.

Postnatal NG2 proteoglycan-expressing progenitor cells are intrinsically multipotent and generate functional neurons

Affiliations

Postnatal NG2 proteoglycan-expressing progenitor cells are intrinsically multipotent and generate functional neurons

Shibeshih Belachew et al. J Cell Biol. .

Abstract

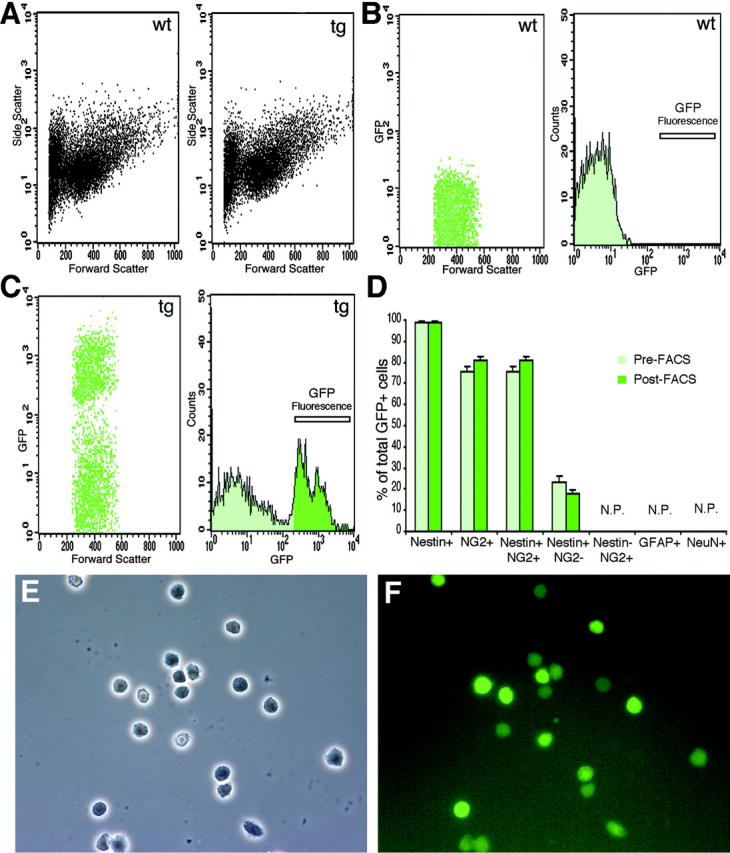
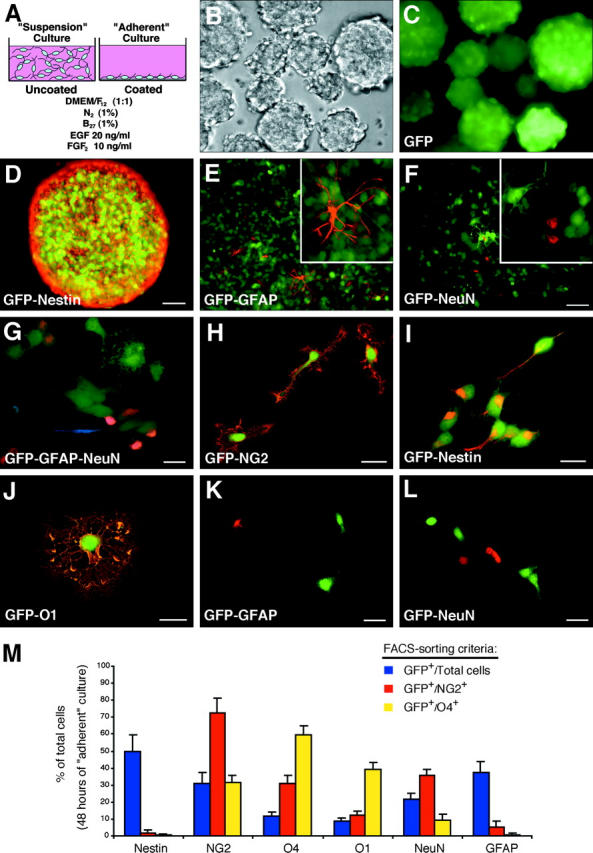
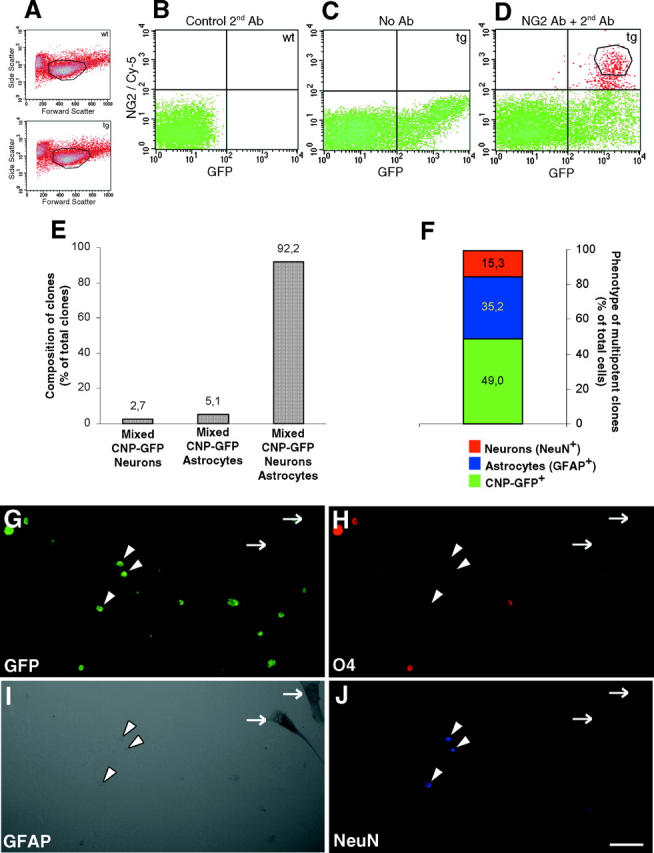
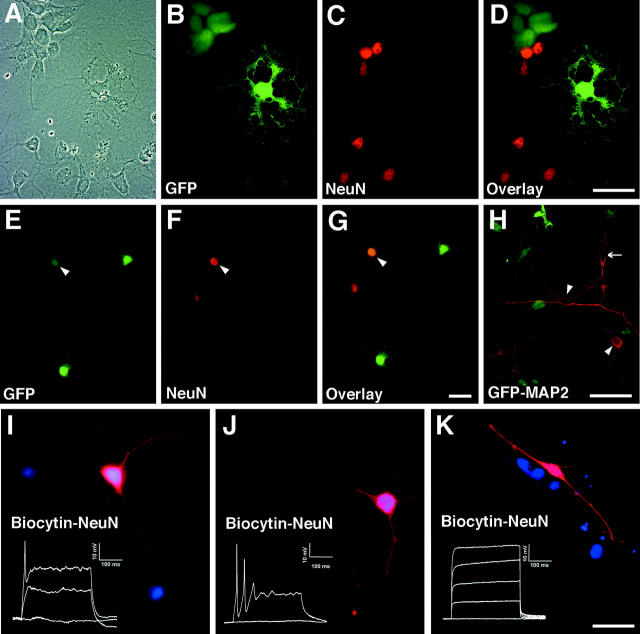
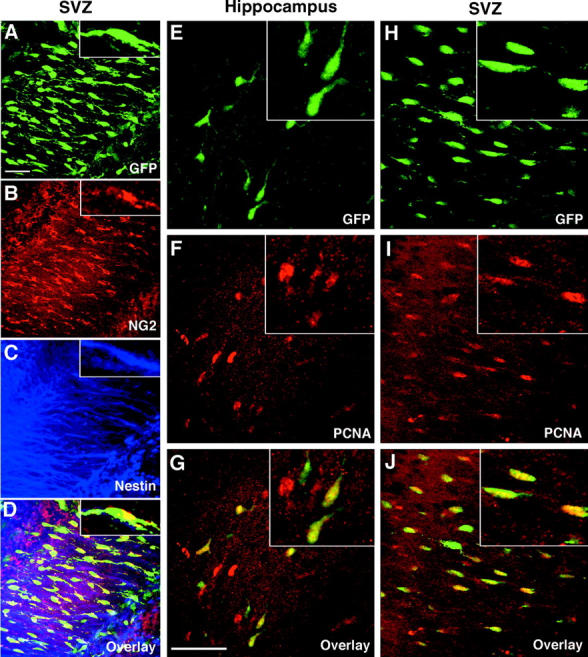
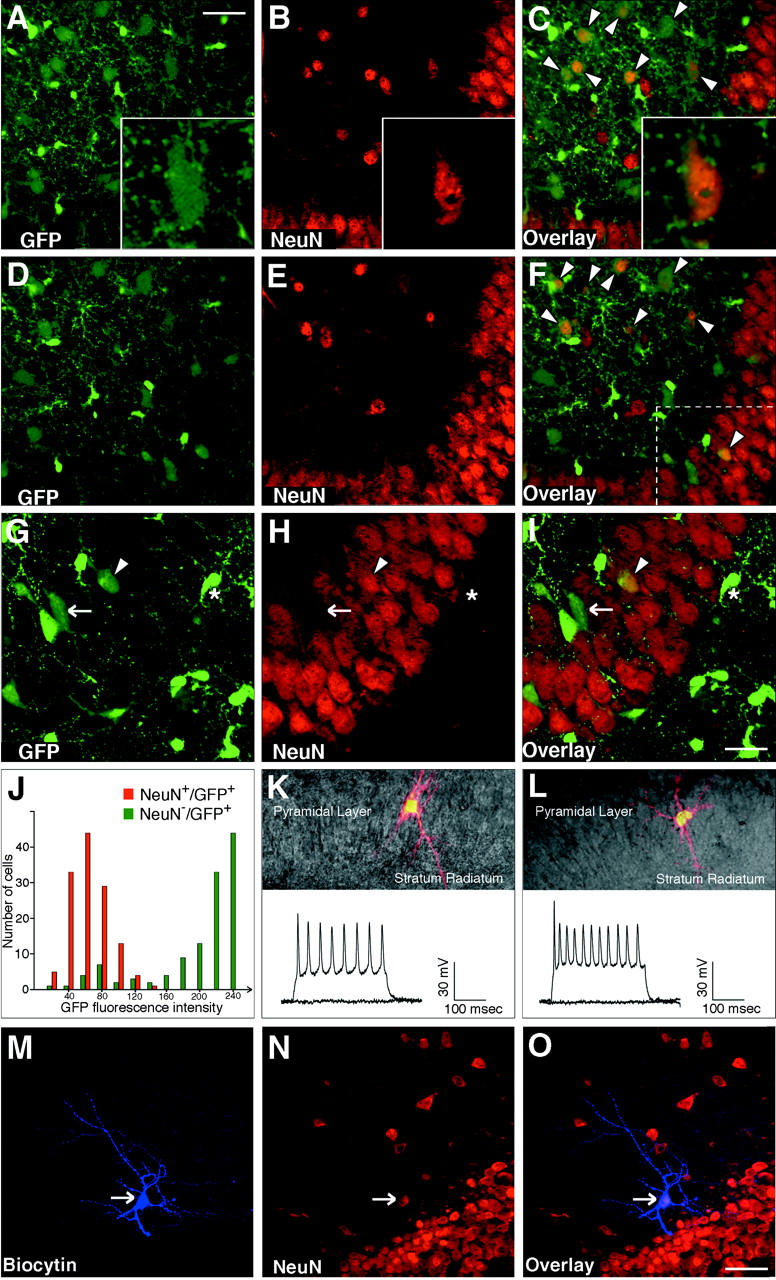
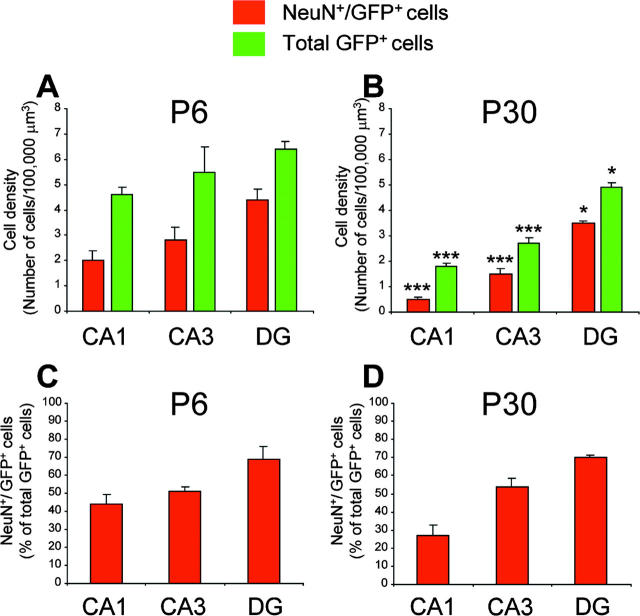
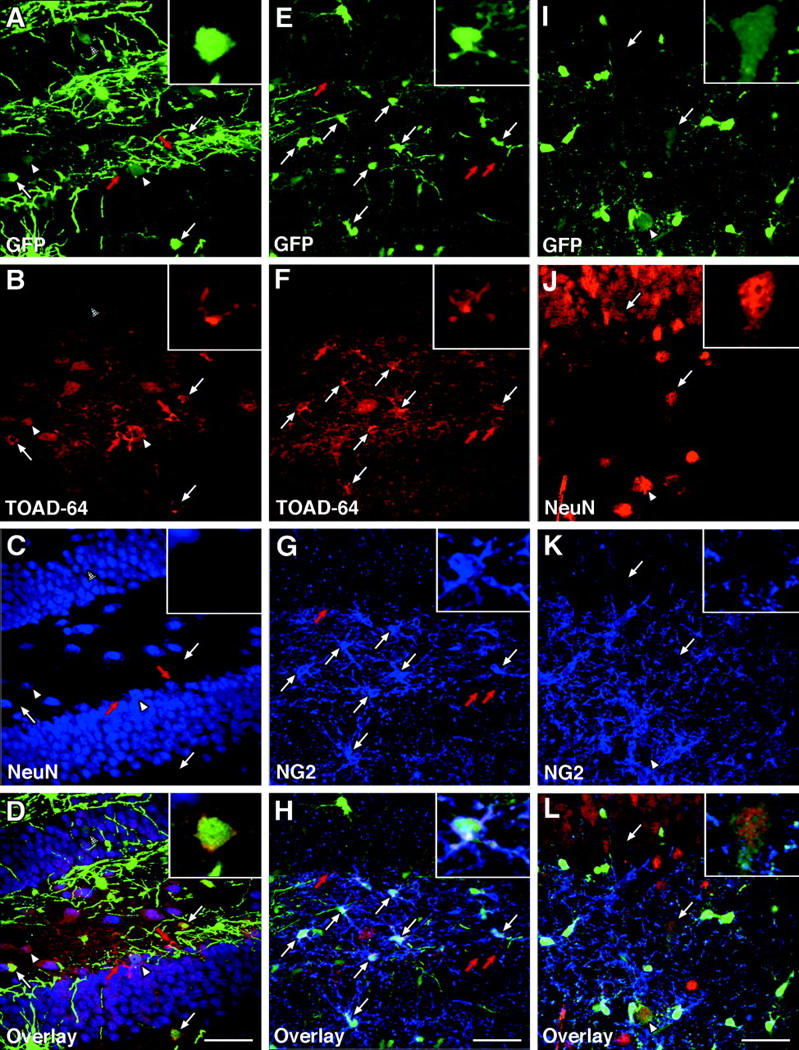
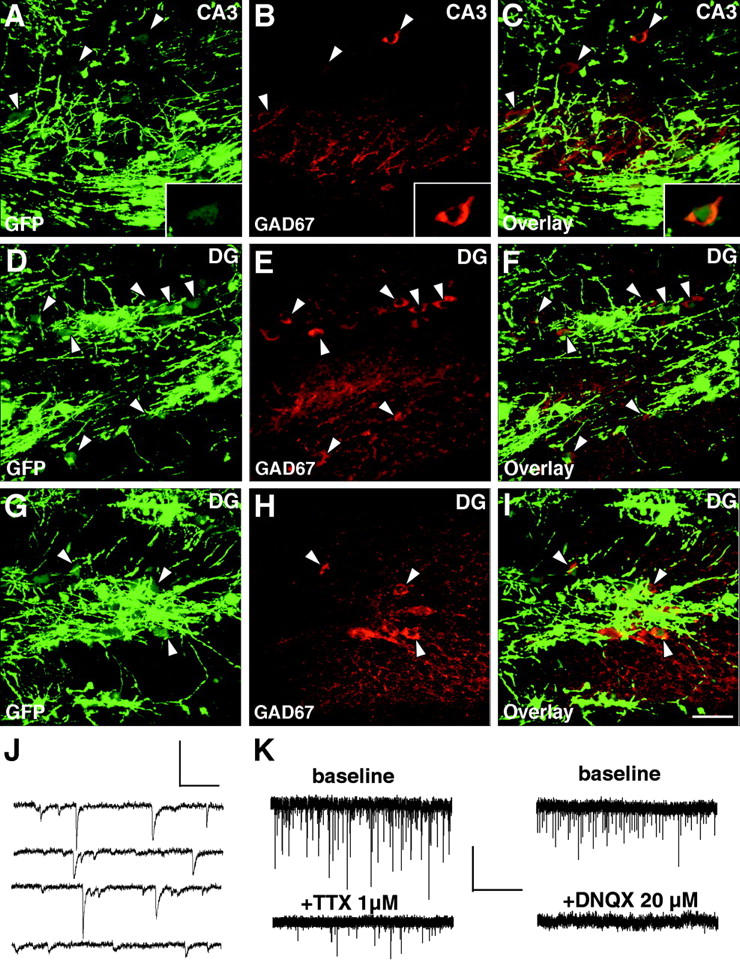
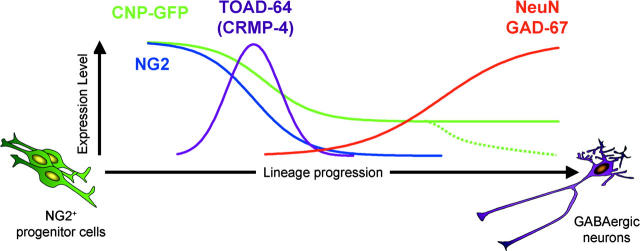
Neurogenesis is known to persist in the adult mammalian central nervous system (CNS). The identity of the cells that generate new neurons in the postnatal CNS has become a crucial but elusive issue. Using a transgenic mouse, we show that NG2 proteoglycan-positive progenitor cells that express the 2',3'-cyclic nucleotide 3'-phosphodiesterase gene display a multipotent phenotype in vitro and generate electrically excitable neurons, as well as astrocytes and oligodendrocytes. The fast kinetics and the high rate of multipotent fate of these NG2+ progenitors in vitro reflect an intrinsic property, rather than reprogramming. We demonstrate in the hippocampus in vivo that a sizeable fraction of postnatal NG2+ progenitor cells are proliferative precursors whose progeny appears to differentiate into GABAergic neurons capable of propagating action potentials and displaying functional synaptic inputs. These data show that at least a subpopulation of postnatal NG2-expressing cells are CNS multipotent precursors that may underlie adult hippocampal neurogenesis.


Figures

Figure 1.
Figure 1.
FACS ® purification of early postnatal GFP + cells from CNP-GFP transgenic brains reveals an NG2 + /nestin + phenotype. FACS® analysis of acutely dissociated cell suspensions of P2 whole brain from CNP-GFP transgenic mice (tg) and wild-type (wt) littermates displayed identical light forward and side scatter distributions (A). To eliminate erythrocytes and cell debris, forward scatter gating parameters were chosen for further GFP fluorescence analysis (B and C, left panels). Cells from CNP-GFP suspensions that were considered GFP+ and FACS®-selected, were in a range of fluorescence (C, bar in right panel) far above (ratio >5×) maximal background intensity yielded by the wild-type cell suspension (B, bar in right panel). Using such criteria, all FACS®-sorted cells were consistently found to be GFP+, as determined by fluorescence microscopy analysis of cell suspensions plated on coverslips immediately after sorting, and fixed 1 h later (two independent experiments, total cells counted = 1,069, 100% were GFP+; E and F). (D) Immunocytochemical characterization of pre-FACS® and post-FACS® cell suspensions (total GFP+ counted cells = 1069, two independent experiments). N.P., not present. We demonstrated here that pre-FACS® versus post-FACS® GFP+ cells were antigenically identical and mostly expressed an NG2+/nestin+ phenotype. This validated our fluorescence sorting criteria, which did not preferentially select a subset of CNP-GFP+ cells. Phase-contrast (E) and fluorescence (F) views of FACS®-selected cells that were all GFP+.
Figure 2.
Figure 2.
Early postnatal CNP-GFP + cells generate multipotent neurospheres and give rise to neurons, astrocytes, and oligodendrocytes in vitro. (A) Culture conditions. Phase-contrast (B) and fluorescence (C) views of GFP+ neurospheres grown in suspension (5 d in vitro) on uncoated substrate in EGF- and FGF2-containing medium (SCM). (D) A clonally expanded GFP+ neurosphere expressed high levels of nestin immunostaining (red). Clonal spheres gave rise to GFAP+/GFP astrocytes (E, red) and NeuN+/GFP neurons (F, red) within 2 d post-plating on polyornithine-coated coverslips. G shows GFAP+ (blue) astrocytes, NeuN+ (red) neurons, and GFP+ oligodendroglial cells derived from a single clonal GFP+ sphere. When cultured in adherent conditions, i.e., on polyornithine-coated surface directly after FACS® sorting, NG2+(H, red)/nestin+(I, red) GFP+ cells also expressed a multipotent fate within 2 d in SCM, and generated mature O1+(J, red)/GFP+ oligodendrocytes, GFAP+(K, red)/GFP astrocytes and NeuN+(L, red)/GFP neurons. Bar: 50 μm (B–D and E–F), 25 μm (G, K, and L), and 20 μm (H–J). M shows quantitative analysis of the multipotent properties of CNP-GFP+ cells. Histograms represent immunocytochemical characterization (% of total cells in y axis, immunophenotypes in x axis) of the progeny of early postnatal (P2) FACS®-purified CNP-GFP+ cells cultured directly under adherent conditions for 48 h in SCM. Comparison was made between the fate of total CNP-GFP+ cells (blue) versus selected subsets of CNP-GFP+ cells that were FACS®-purified according to their NG2+/CNP-GFP+ (red) or O4+/CNP-GFP+ (yellow) phenotype. Nestin, NG2, O4, O1, NeuN, and GFAP phenotypes were analyzed. Values (mean ± SEM) represent averages of 2–3 independent experiments. Counting was performed separately for each staining, and the number of total cells counted (from at least 15 separate microscopic fields) ranged between 403 and 714. Significant differences reported in the Results section were all with a P value <0.001 (t test).
Figure 3.
Figure 3.
Clonal analysis of NG2 + /CNP-GFP + cells in vitro. (A) FACS® dot plots of acutely dissociated cells from wild-type (wt, top) and CNP-GFP transgenic brains (tg, bottom), in forward and side scatter with a polygon indicating the gate selecting the viable cells. (B–D) Sorting profiles of acutely isolated cell suspensions from P2 brains of wild-type (B) and CNP-GFP transgenic mice (C and D) dot plotted according to fluorescence intensity for GFP (x axis, logarithmic scale) and Cy-5 (fluorescence associated to secondary antibody recognizing NG2 immunoreactivity, y axis, logarithmic scale). (B) Control wild-type cells that were incubated only with the Cy-5–conjugated secondary antibody without anti-NG2 primary antibody. Crossed black lines in B–D represent thresholds of fluorescence. It was observed that <0.01% (limit of detection) of the control cells from B fell over this threshold. Thus, these lines determined the level of fluorescence above which cells from CNP-GFP brains (C) were selected as GFP+ (lower right quadrant). When CNP-GFP cell suspensions were immunostained for NG2 (D), NG2+/CNP-GFP+ cells were detected in upper right quadrant. To ensure accurate purification of NG2+/CNP-GFP+ cells, the sort gate for these cells (D, polygon) was defined by taking an additional margin (0.2–0.3 log units) with respect to background fluorescence levels. (E) FACS®-purified early postnatal (P2) NG2+/CNP-GFP+ cells were cultured at clonal density for 1 wk in SCM and the phenotype of resulting cell clones was then determined. (F) Relative proportion of the different subpopulations found in the multipotent clones, i.e., containing CNP-GFP+ cells, as well as neurons (NeuN+) and astrocytes (GFAP+). (G–J) GFP fluorescence (G, green), O4 (H, red), GFAP (I, peroxidase reaction), and NeuN (J, blue) stainings of the same microscopic field showing a representative multipotent clone derived from the growth of a single NG2+/CNP-GFP+ cell after one week in SCM. NeuN+ cells (arrowheads) are still retaining CNP-GFP fluorescence at this stage, whereas in GFAP+ astrocytes GFP expression has been lost (arrows). Bar, 50 μm for G–J.
Figure 4.
Figure 4.
CNP-GFP + cells gradually lose GFP expression as they differentiate into mature, excitable neurons in culture. Phase-contrast view (A), GFP green fluorescence (B), NeuN staining (C, red), and overlay (D) of the same microscopic field showing NeuN+/CNP-GFP neuronal progeny derived from P2 FACS®-purified CNP-GFP+ cells after 48 h in SCM. Cells expressing low levels of GFP, but displaying a neuronal phenotype could also be found (E–H). These cells expressed the neuronal markers NeuN (same microscopic field with GFP green fluorescence in E, red NeuN staining in F, and overlay in G) and MAP2a,b (H, red staining). Arrowheads indicate NeuN+/CNP-GFP+ (E–G) and MAP2a,b +/CNP-GFP+ cells (H). Arrow in H points to a MAP2a,b-expressing neuron that has completely lost GFP expression. (I–K) Electrophysiological whole-cell patch-clamp experiments in current-clamp mode were performed, in order to study excitability of cell progeny arising from SCM-cultured FACS®-sorted CNP-GFP+ cells. After 2 d in SCM, cultures were switched to EGF- and FGF2-free medium supplemented with a combination of 30 ng/ml brain-derived neurotrophic factor and 30 ng/ml neurotrophin-3 for one week. GFP+ and GFP cells were analyzed and filled with biocytin during electrophysiological recording for identification and further immunocytochemical characterization. We recorded only GFP cells that did not display a typical astrocytic morphology. Depolarization of GFP cells elicited single (7 out of 9 cells; I, inset), or repetitive (2 out of 9 cells; J, inset) action potentials. In five of these cells, we investigated biocytin (red) and NeuN (blue) immunoreactivities, and in all cases colocalization (purple) was observed (I–J). In contrast, all GFP+ cells tested (12 cells) did not elicit action potentials (K, inset). Out of the GFP+ cells that were immunostained after recording (6 cells), all were NeuN (K; biocytin in red, NeuN in blue). (I–K) GFP expression could not be visualized because of dialysis associated with whole-cell recording. Bars: 25 μm (A–D), (E–G), (H), and (I–K).
Figure 5.
Figure 5.
Early postnatal CNP-GFP + cells are proliferative and display an NG2 + /nestin + phenotype in vivo in the SVZ and hippocampus. As illustrated by Z-series (A–D, 22-μm thickness, image steps = 0.5 μm) confocal scanning images of the same field in SVZ area from P2 CNP-GFP transgenic mice, CNP-GFP+ cells expressed an NG2+/nestin+ phenotype. 1-μm thick single plane images of a single cell at high magnification are provided in insets of A–D. The same phenotype was observed in the hippocampus (not depicted). (A) GFP green fluorescence, (B) NG2 staining, (C) nestin staining, (D) overlay. As shown in E–J (high magnification in insets), CNP-GFP+ cells were proliferative in vivo. 0.5-μm thick single plane confocal scanning images of CA3 stratum radiatum area of hippocampus (E–G) and SVZ (H–J) from P2 CNP-GFP transgenic mice. (E and H) GFP green fluorescence, (F and I) PCNA staining, (G and J) overlay. A high percentage of CNP-GFP+ cells were PCNA+ in both germinative areas. Bars: 50 μm (A–D) and (E–J).
Figure 6.
Figure 6.
A subset of postnatal NeuN + hippocampal neurons express low levels of CNP-GFP and are electrically excitable. (A–F) 0.5-μm thick single plane confocal scanning images representing two different levels (levels of planes in A–C and D–F are separated by 4 μm) of the same field of CA3 region of hippocampus from P6 CNP-GFP transgenic mice revealed that some cells were NeuN (red)-immunoreactive and expressed GFP fluorescence (A–C, insets of high magnification of a single cell). Distinct microscopic planes (A–C and D–F) within the same cells (C and F, arrowheads) showed a diffuse colocalization of the two signals, providing a more accurate demonstration of NeuN/CNP-GFP coexpression. Most of these NeuN+/CNP-GFP+ cells were located in the stratum radiatum, but sparse NeuN+/CNP-GFP+ cells were also found in the pyramidal layer (G–I, arrowhead). (G–I) Z-series (10 μm thick) confocal scanning image centered on the dashed area of (F) at higher magnification. Lower levels of GFP fluorescence were detected in all NeuN+/CNP-GFP+ cells (C, F, and G–I, arrowheads), as compared with CNP-GFP+ cells from the same field (G–I, star), that were NeuN. Cells that expressed low levels of GFP that were NeuN were also found (G–I, arrow). (J) Quantitative image analysis of GFP fluorescence intensity (linear arbitrary scale from 0 to 250 U; paired columns represent incremental intervals of 20 arbitrary fluorescence units) revealed a bimodal distribution, demonstrating that the average GFP fluorescence of NeuN+/CNP-GFP+ neurons (red) was 3.5-fold lower than that of NeuN/CNP-GFP+ cells (green; total cells counted = 252, two independent experiments, equal number of cells analyzed for each population). Electrophysiological recordings were performed in weakly CNP-GFP+ cells from the CA1 and CA3 pyramidal layer of P3–P8 hippocampal slices (K–L). Upper parts of K–L represent single examples of fluorescence images showing the neuron-like arborized morphology of two different CNP-GFP+ cells recorded in CA3 and visualized after filling with a rhodamine-coupled dye. Lower parts of K–L display repetitive action potentials elicited by depolarizing the same cells with electrotonic current pulses (step size = 10–30 pA, step duration = 300 ms). (M–O) Representative example of a biocytin-filled (arrow in M) recorded cell in the CA3 stratum radiatum area, showing that cells that expressed low levels of GFP and that were able to propagate action potentials were consistently NeuN+ (arrow in N and O) by post-hoc immunostaining. Bars: 50 μm (A–F), 33 μm (G–I), and 60 μm (M–O).
Figure 7.
Figure 7.
Developmental and anatomical distribution of NeuN + /CNP-GFP + neurons in the postnatal hippocampus. The anatomical distribution of NeuN+/CNP-GFP+ cells was analyzed in Z-series confocal scanning images (20–32 μm of thickness, step size = 0.5 μm between successive images of the same field) from P6 (A and C) and P30 (B and D) hippocampus. Square fields of 228 μm2 were separately acquired in CA1, CA3, and the dentate gyrus (DG). We calculated the absolute density of total CNP-GFP+ cells and NeuN+/CNP-GFP+ cells in each area at P6 (A) and P30 (B). We found developmental changes in the percentage of NeuN+/CNP-GFP+ cells within the CNP-GFP+ population only in CA1 between P6 (C) and P30 (D). Histogram values represent mean ± SEM (total GFP+ cells counted = 841, two independent experiments). Statistical data pointed out in B were derived from the comparison of each P30 experimental parameter with its identical counterpart at P6. ***, P < 0.001; *, P < 0.05 (t test).
Figure 8.
Figure 8.
The existence of NG2 + /TOAD-64 + /CNP-GFP + immature hippocampal neurons establishes a lineage continuum between NG2 + /CNP-GFP + progenitor cells and NG2 /NeuN + /CNP-GFP + neurons in the adult dentate gyrus. Confocal photomicrographs (merged images from 4–6 optical sections of 0.5 μm each) of three representative fields of P30 hippocampal slices in which CNP-GFP+ cells were immunolabeled for either TOAD-64 and NeuN (A–D, dentate gyrus), TOAD-64 and NG2 (E–H, dentate gyrus), or NeuN and NG2 (I–L, CA3). 0.5-μm thin single plane high magnification images of single cells are shown for each panel as insets located in the upper right corners (A–L). In A–D and E–H, white arrows point to NG2+/TOAD-64+/CNP-GFP+ early post-mitotic neurons that expressed levels of GFP higher than differentiated NG2/NeuN+/CNP-GFP+ neurons (A–D, arrowheads; I–L, arrows). Red arrows in A–D and E–H depict TOAD-64+ neuronal cells that did not express CNP-GFP. Bars, 50 μm for all panels.
Figure 9.
Figure 9.
CNP-GFP + postnatal hippocampal neurons are mostly GABAergic and receive functional synaptic inputs. Representative confocal images from CA3 (A–C) and dentate gyrus (D–F and G–I; merged images of 4–6 optical sections of 0.5–0.75 μm); three adjacent fields of the same P30 hippocampal slice showed the typical spatial distribution of CNP-GFP+ cells immunoreactive for GAD-67 (examples depicted by arrowheads). 0.5-μm thin single plane high magnification images of a single cell are shown in A–C as insets located in the lower right corners. All GAD-67+/CNP-GFP+ neurons displayed relatively low levels of GFP fluorescence. Bar, 50 μm for all panels A–I. (J) Continuous recording (total = 2.4 s) of spontaneous post-synaptic currents under voltage clamp (−60 mV) in a CNP-GFP+ neuron of the hilar dentate gyrus area (Scale: 0.5 s, 50 pA). (K) Synaptic activity of dentate gyrus CNP-GFP+ neurons was blocked by application of 1 μM TTX and 20 μM DNQX (Scale: 30 s, 50 pA). Spontaneous synaptic currents recorded in baseline conditions were compared with those of the same cell (bottom traces) 2 min after drug application.
Figure 10.
Figure 10.
Developmental regulation of neural markers in CNP-GFP lineage cells. This scheme represents a summary of the antigenic markers expressed at different stages of neuronal differentiation of NG2+/CNP-GFP+ cells in the postnatal hippocampus.

References

    1. Altman, J., and G.D. Das. 1965. Autoradiographic and histological evidence of postnatal hippocampal neurogenesis in rats. J. Comp. Neurol. 124:319–335. - PubMed
    1. Alvarez-Buylla, A., and S. Temple. 1998. Stem cells in the developing and adult nervous system. J. Neurobiol. 36:105–110. - PubMed
    1. Alvarez-Buylla, A., J.M. Garcia-Verdugo, and A.D. Tramontin. 2001. A unified hypothesis on the lineage of neural stem cells. Nat. Rev. Neurosci. 2:287–293. - PubMed
    1. Bansal, R., and S.E. Pfeiffer. 1997. a. FGF-2 converts mature oligodendrocytes to a novel phenotype. J. Neurosci. Res. 50:215–228. - PubMed
    1. Bansal, R., and S.E. Pfeiffer. 1997. b. Regulation of oligodendrocyte differentiation by fibroblast growth factors. Adv. Exp. Med. Biol. 429:69–77. - PubMed

Publication types

MeSH terms