. 2003 Apr 7;197(7):831-44.
doi: 10.1084/jem.20021417.

The transcriptional repressor Gfi1 affects development of early, uncommitted c-Kit+ T cell progenitors and CD4/CD8 lineage decision in the thymus

Affiliations

The transcriptional repressor Gfi1 affects development of early, uncommitted c-Kit+ T cell progenitors and CD4/CD8 lineage decision in the thymus

Raif Yücel et al. J Exp Med. .

Abstract

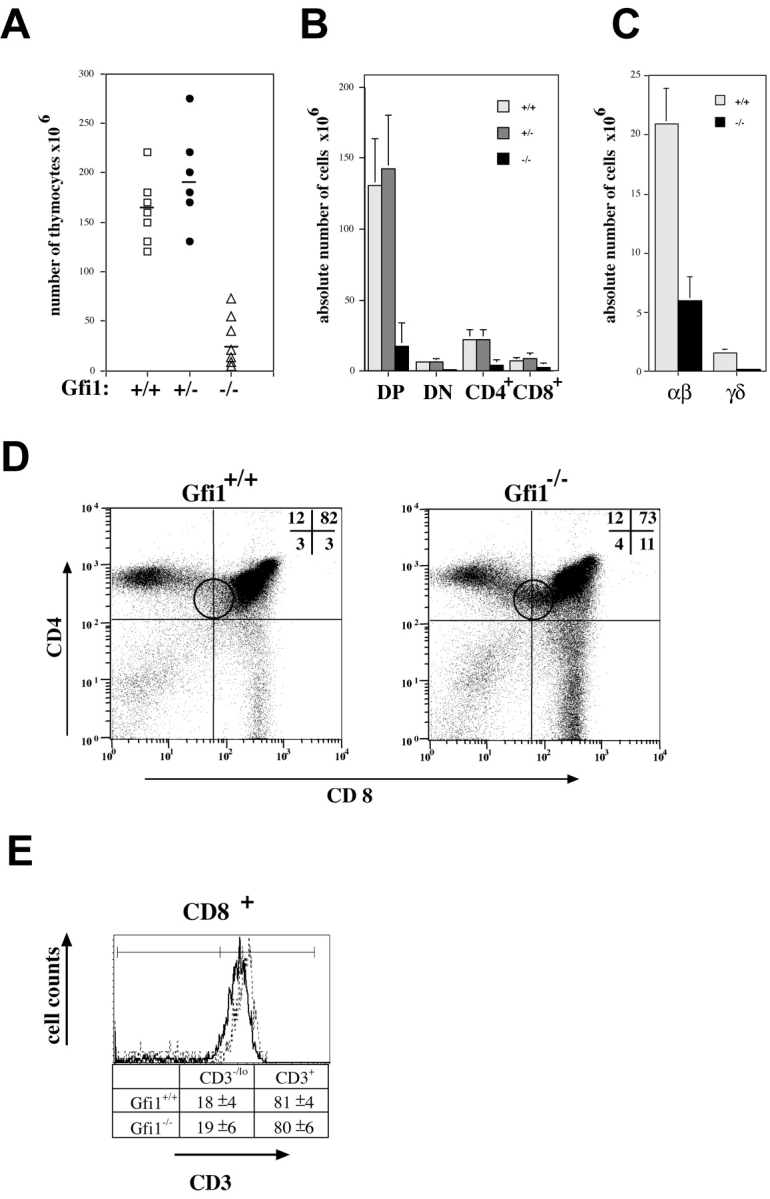
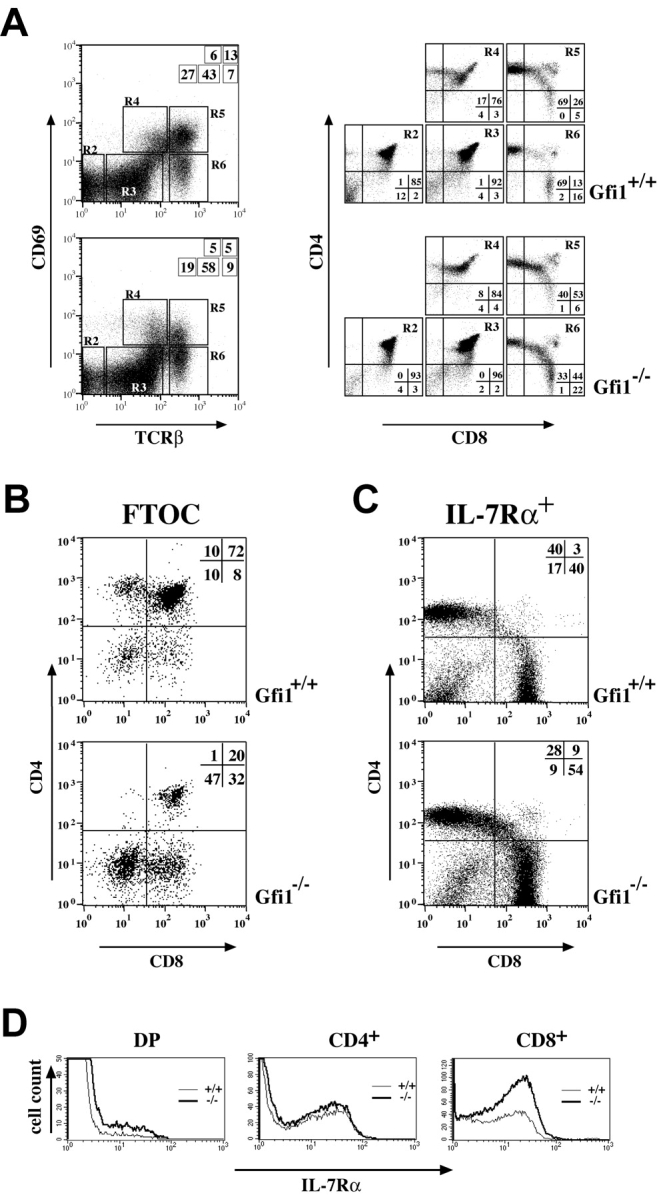
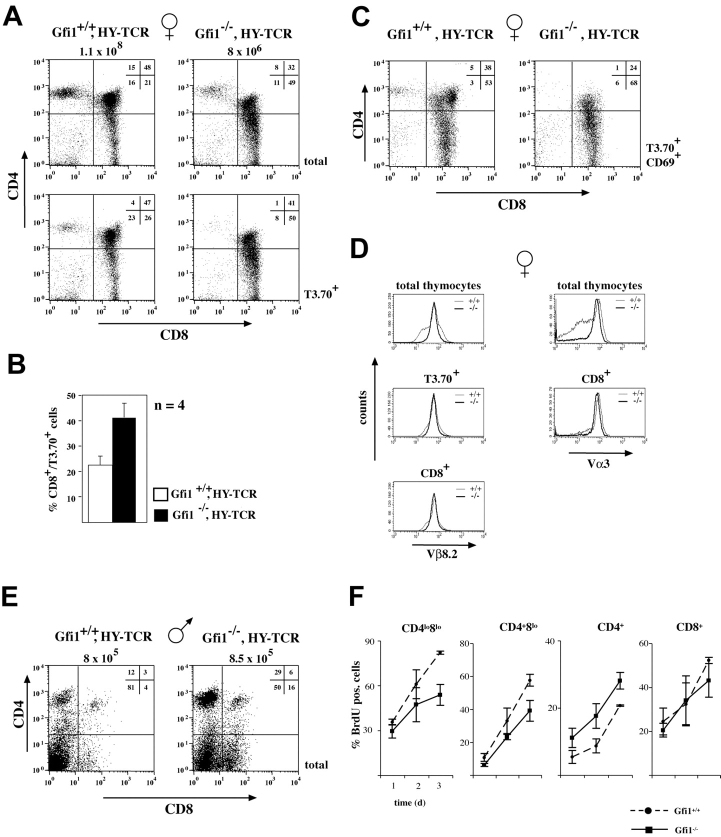
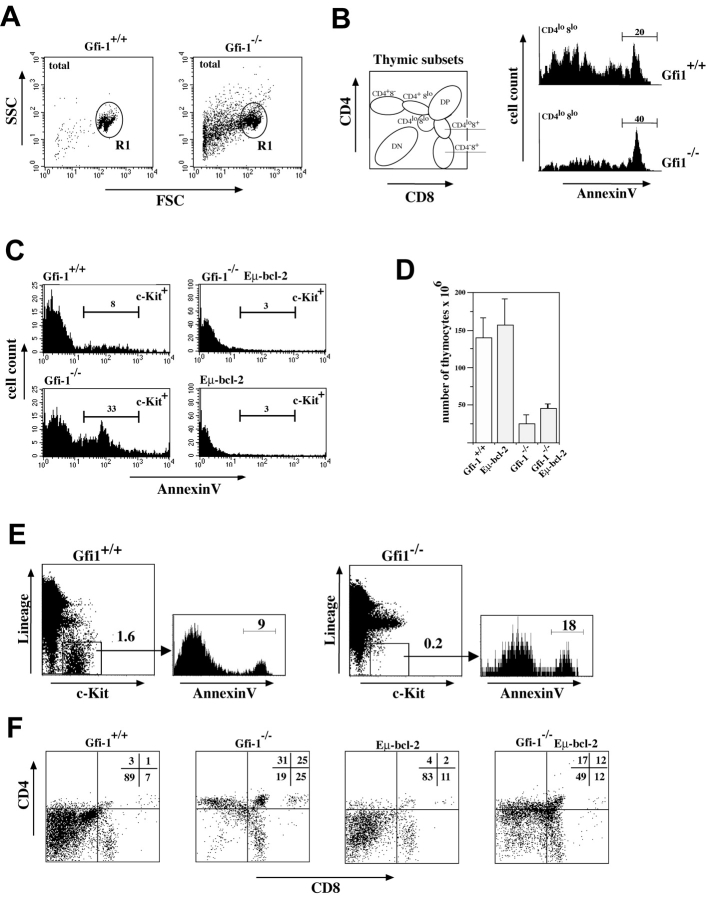
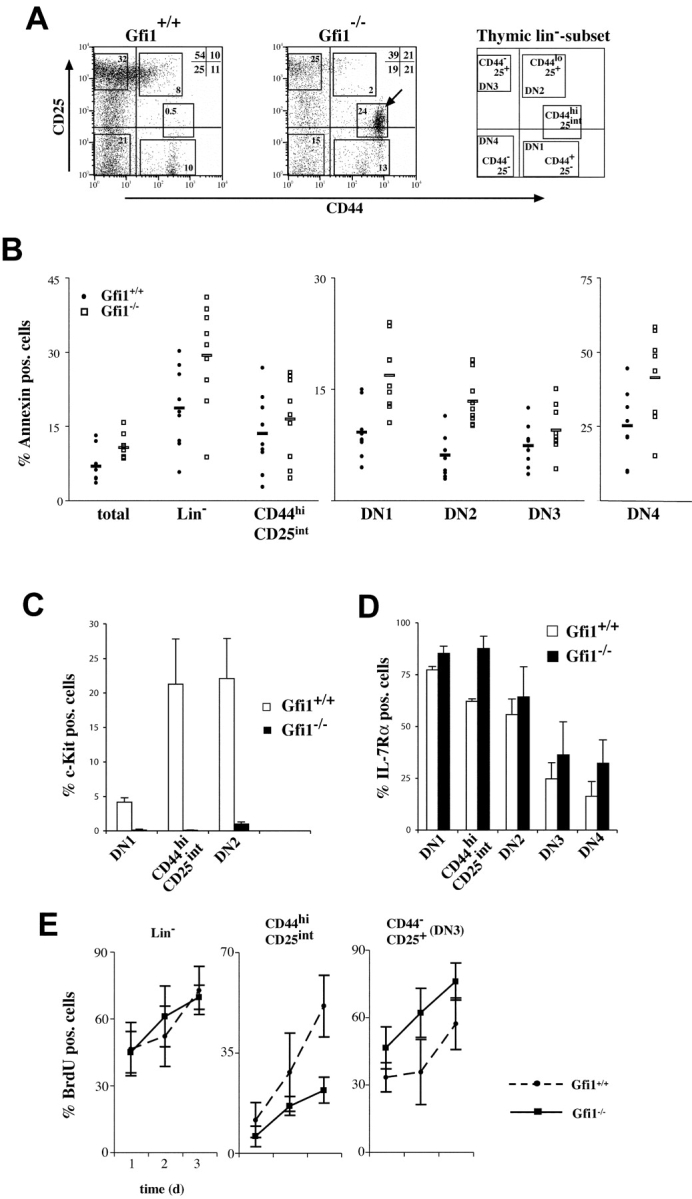
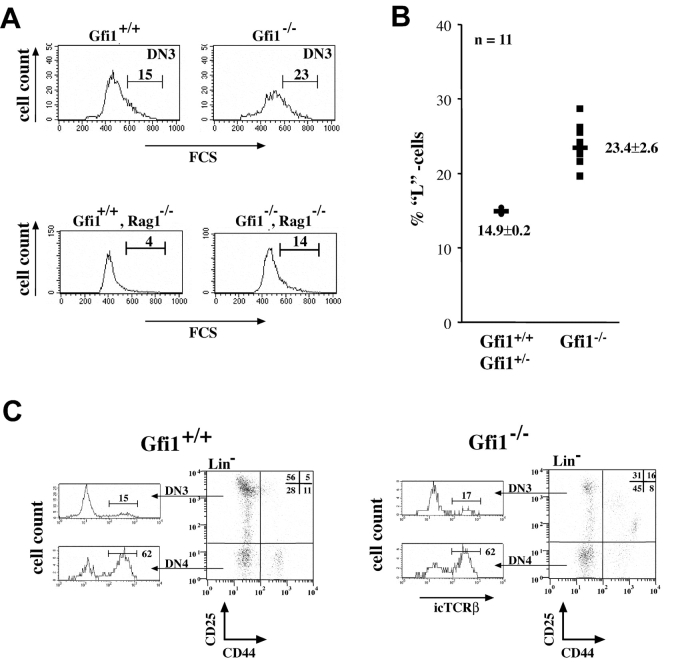
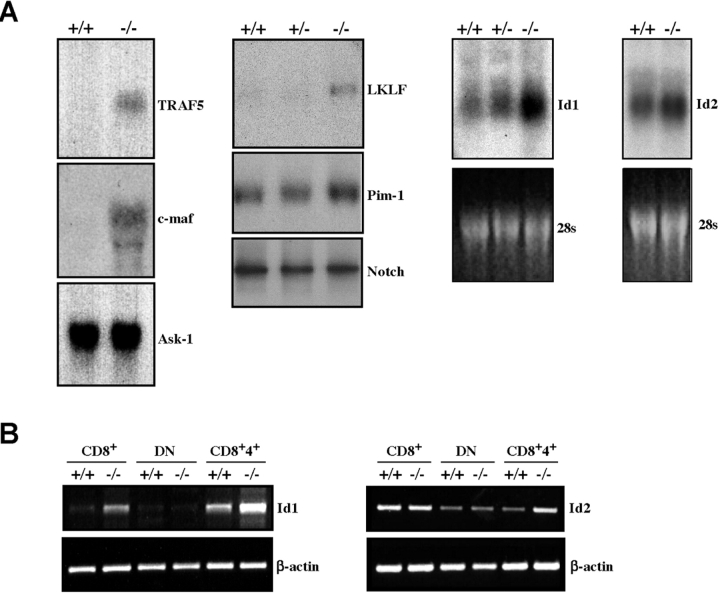
In the thymus, several steps of proliferative expansion and selection coordinate the maturation of precursors into antigen-specific T cells. Here we identify the transcriptional repressor Gfi1 as an important regulator of this maturation process. Mice lacking Gfi1 show reduced thymic cellularity due to an increased cell death rate, lack of proliferation, and a differentiation block in the very early uncommitted CD4-/CD8-/c-Kit+ cytokine-dependent T cell progenitors that have not yet initiated VDJ recombination. In addition, Gfi1-deficient mice show increased major histocompatibility complex class I-restricted positive selection and develop significantly more CD8+ cells suggesting a requirement of Gfi1 for a correct CD4/CD8 lineage decision. Absence of Gfi1 correlates with high level expression of the genes for lung Krüppel-like factor (LKLF), inhibitor of DNA binding (Id)1 and Id2, suggesting the existence of new regulatory pathways in pre-T cell development and thymic selection in which Gfi1 acts upstream of LKLF as well as the E-proteins, which are negatively regulated by Id1 and Id2.


Figures

Figure 1.
Figure 1.
Gfi1−/− mice show impaired thymocyte development and reduced thymic cellularity. (A) Absolute thymocyte numbers from Gfi1-deficient mice (▵) are reduced compared with those from their WT (□) or heterozygous littermates (•). The average cell number is indicated by a solid line. (B and C) Thymocytes from 4–6-wk-old WT, Gfi1+/−, and Gfi1−/− mice were isolated, stained with anti-CD4, anti-CD8 antibodies, or with antibodies recognizing TCRβ chain or γ/δ chains and were analyzed by flow cytometry. Absolute numbers of all four CD4/CD8 subsets and of TCR-bearing cells representative of several animals are documented. (D) Cytofluorimetric analysis showing the relative percentages of cells bearing CD4 or CD8 surface markers of normal control littermates (left) and Gfi1-deficient mice (right). The percentage of CD8 SP cells is increased from 3 to 11% whereas the percentage of CD4 SP cells remained unchanged in Gfi1−/− mice. In addition, the percentage of DP cells is decreased to 73% in the absence of Gfi1 and a new CD4+ CD8lo population appears in Gfi1−/− mice (round gate). These alterations are consistently found in all analyses. Representative examples of ∼10 6-wk-old animals for each genotype are shown. (E) Flow cytometric analysis of CD3 expression of electronically gated CD8+ cells of both WT and Gfi1null mice. A representative histogram for each subset and compiled percentages of CD3+- and CD3−/lo-expressing cells is shown. The number represents means with standard deviations from six individual WT and six individual Gfi1-deficient mice. The dotted line represents WT animals and the dark line represents the Gfi1-deficient cells.
Figure 2.
Figure 2.
Gfi1−/− mice show an imbalance of CD4 and CD8 SP cells in positively selected subsets and show altered IL-7Rα expression in DN subsets. (A) Thymic subpopulation defined by the expression of CD69 and the TCRβ chain. Total thymocytes were stained for the presence of CD69, TCRβ, CD4, and CD8 and were analyzed by four-color flow cytometry. Gates in the CD69/TCRβ analysis are indicated (left, R2–R6). The subsets R2–R6 were reanalyzed for CD4 and CD8 expression (right). Relative percentages of cells are depicted as insets. The analysis was performed on four independent sets of Gfi1-deficient (Gfi1−/−) and WT (Gfi1+/+) animals. (B) Two-color analysis of CD4- and CD8-stained cells from d13 fetal thymi after 5 d in culture showing a dramatically reduced number of CD4 SP thymocytes in cultures from Gfi1-deficient mice (+/+, n = 4 and −/−, n = 5). (C) Three-color flow cytometric analysis of CD4 and CD8 expression gated on IL-7Rα+ thymocytes. A significant decrease of relative percentages of CD4 SP cells and a relative increase of the CD8 SP population can be observed in Gfi1−/− mice compared with the WT control in all cases. All analyses are representative for at least six individual sets of animals. (D) Three-color analysis of IL-7Rα chain expression gated on DP and CD4 or CD8 SP cells. Thin lines indicate the WT (+/+) control animal and the thick line represents the Gfi1-deficient mouse (−/−).
Figure 3.
Figure 3.
Lack of Gfi1 alters MHC class I–restricted positive selection. (A) Flow cytometric analysis of CD4 and CD8 expression of total or T3.70+ thymocytes from female WT (Gfi1+/+) or Gfi1−/− mice expressing the HY-TCR transgene. Total thymocyte numbers and the percentages of the respective DN, DP, and SP cells are indicated. Experiments are representative for five different sets of mice. (B) Compilation of percentages of CD8+/T3.70+ cells from seven female Gfi1+/+ HY-TCR animals (open bar) and from seven female Gfi1−/− HY-TCR animals (solid bar). (C) CD69+/T3.70+ thymocytes from female WT (Gfi1+/+) or Gfi1−/− mice expressing the HY-TCR transgene. Total thymocyte numbers and the percentages of the respective DN, DP, and SP cells are indicated. Experiments are representative for five different sets of mice. (D) CD8+ or total thymocytes of both HY-TCR transgenic mice and Gfi1−/− carrying the HY-TCR transgene were analyzed with an antibody against the Vβ8.2 or the Vα3 variable chain of the HY-TCR. The Vα3 chain was detected with the T3.70 clonotypic antibody. (E) Flow cytometric analysis of CD4 and CD8 expression on thymocytes from 8-wk-old male WT (Gfi1+/+) or Gfi1−/− mice expressing the HY-TCR transgene. Total thymocyte numbers and the percentages of the respective DN, DP, and SP cells are indicated. (F) Three WT and three Gfi1null mice were analyzed for BrdU incorporation for each time point over a period of 3 d. The indicated cell subsets were analyzed by flow cytometric measurements and the percentages of BrdU+ cells were determined. Values are means with standard deviations and are plotted against the time in days (d).
Figure 4.
Figure 4.
Cell survival and proliferation is disturbed in Gfi1−/− mice. (A) Thymocytes of Gfi1−/− mice (−/−) and WT controls (+/+) were analyzed on forward/sideward scatter for morphology and apparently intact cells were gated (R1). (B) Thymocytes of Gfi1−/− mice (−/−) and WT controls (+/+) were stained for CD4, CD8, and annexin V and gated according to Germain (reference 42) in seven subsets, which are schematically depicted. The subsets were electronically selected and analyzed for annexin V binding gated in forward/sideward scatter on R1. Histograms for the CD4lo CD8lo thymocyte population from WT (Gfi1+/+) or Gfi1-deficient (Gfi1−/−) mice are shown. (C) Thymocytes were stained with annexin V–FITC and c-Kit–PE and gated in forward/sideward scatter on R1. The percentages of c-Kit+ thymocytes that are able to bind annexin V–FITC for Gfi1−/− mice (−/−), WT controls (+/+), Eμ bcl-2 transgenic mice or double mutants lacking Gfi1 and expressing the Bcl-2 transgene (Gfi1−/−, Eμ bcl-2) are depicted. (D) Comparison of the total number of thymocytes of Gfi1+/+ (WT controls), Gfi1−/− mice, Eμ bcl-2 animals, and combinatorial mutant mice lacking Gfi1 and bearing the Eμ bcl-2 transgene (Gfi1−/−, Eμ bcl-2). (E) Thymocytes from WT (Gfi1+/+) or Gfi1−/− mice were stained with antibodies against Lin markers and for c-Kit expression and analyzed by three-color flow cytometry for annexin V binding (representative for n = 4 WT and n = 4 Gfi1−/− mice). (F) Thymocytes from WT (Gfi1+/+) or Gfi1−/− mice were stained for CD4, CD8, and c-Kit expression and were analyzed by three-color flow cytometry. The analysis shows CD4 and CD8 expression on electronically selected c-Kit+ cells. In particular, DN cells are depleted of c-Kit+ cells in the Gfi1−/− mice. All datasets are representative of four to five independent experiments with individual mice.
Figure 5.
Figure 5.
Depletion of c-Kit+ cells and alterations of DN subpopulations in Gfi1−/− mice. (A) Flow cytometric analysis of CD25 and CD44 expression among electronically gated Lin negative (Lin) thymocytes. Relative percentages of DN2, DN3, and DN4 cells appear to be altered in Gfi1−/− mice compared with normal (Gfi1+/+) controls and the emergence of a new population is noted (arrowhead, CD44hi CD25int; n = 10 for each genotype). (B) Thymocytes from WT (Gfi1+/+) or Gfi1−/− animals were stained for expression of Lin markers CD44 and CD25. Lin cells and the indicated subsets were analyzed for annexin V binding. The gates for the DN subsets were as indicated in A. The percentage of annexin V+ cells for the indicated subsets is given. The analysis reveals that only the DN1 and DN2 subsets of Gfi1null mice contain significantly more apoptotic cells (n = 9 for each genotype). The mean values for Gfi1-deficient and WT DN1 cells are 16.8 ± 4.8% and 9.1 ± 3.5%, respectively. This difference is significant at the 0.05 level (P = 0.004). The mean values for Gfi1-deficient and WT DN2 cells are 13.3 ± 3.3% and 6.0 ± 2.9%, respectively. This difference is significant at the 0.05 level (P = 0.001; Student's t test). (C) Lin thymocytes from WT (Gfi1+/+) or Gfi1−/− mice were stained for CD44, CD25, and c-Kit expression. The percentage of c-Kit+ cells is given for the DN1, DN2, and CD25int CD44hi subset in WT and Gfi1null mice (n = 5 for each genotype). (D) Lin thymocytes from WT (Gfi1+/+) or Gfi1−/− mice were stained for CD44, CD25, and IL-7Rα expression. The percentage of IL-7Rα+ cells is given for the DN1, DN2, DN3, DN4, and CD25int CD44hi subset in WT and Gfi1null mice (n = 4 for each genotype). (E) Three WT and three Gfi1null mice were analyzed for BrdU incorporation for each time point over a period of 3 d. The indicated cell subsets were analyzed by flow cytometric measurements and the percentages of BrdU+ cells were determined. Values are means with standard deviations and are plotted against the time in days (d).
Figure 6.
Figure 6.
Gfi1 deficiency disturbs passage through pre-TCR selection but does not affect VDJ recombination. (A) Analysis of the DN3 subset of mice with the indicated genotypes for cell size distribution by forward angle light scattering (FCS). The boundary between E and L cells was set according to Hoffman et al. (reference 26) and as previously described (12). The bracket indicates the percentages of L cells that emerge after pre-TCR selection. Analyses are representative for three individual sets of animals for each genotype. (B) Compiled data from 11 WT or heterozygous (Gfi1+/−) and 11 Gfi1-deficient mice indicating L cell percentages. A mean value and a standard deviation are given. (C) Intracellular TCRβ chain expression levels in DN3 and DN4 subsets. Lin thymocytes were analyzed for expression of CD25 and CD44. The DN3 and DN4 subsets were electronically gated to detect intracellular levels of TCRβ. No difference could be found between normal thymocytes and those negative for Gfi1.
Figure 7.
Figure 7.
Expression of potential downstream effector genes of Gfi1 in thymic T cells. (A) RNA from Gfi1−/− (−/−), Gfi1 heterozygous (+/−), or WT (+/+) animals was analyzed after electrophoretic separation for the expression of TRAF5, c-Maf, Ask-1, LKLF, Pim-1, Notch, as well as Id1 and Id2. The autoradiograms of a representative analysis are depicted. The level of TRAF5, c-Maf, LKLF, and Id1-specific transcripts appears to be strongly up-regulated in Gfi1−/− mice and Id2 transcripts appear to be weakly up-regulated in cells lacking Gfi1. Expression levels of Ask-1, Pim-1, or Notch 1 were not detectably altered in Gfi1-deficient thymocytes compared with WT or heterozygous controls. (B) Expression of Id1 and Id2 in three different subsets of WT (+/+) or Gfi1-deficient (−/−) mice. CD8+ and DN cells were isolated by magnetic beads and the DP cells were obtained by FACS® sorting. Total RNA was isolated from the indicated thymic subsets and was used for an RT-PCR reaction.

Similar articles

Cited by

References

    1. Tong, B., H.L. Grimes, T.Y. Yang, S.E. Bear, Z. Qin, K. Du, W.S. El-Deiry, and P.N. Tsichlis. 1998. The Gfi-1B proto-oncoprotein represses p21WAF1 and inhibits myeloid cell differentiation. Mol. Cell. Biol. 18:2462–2473. - PMC - PubMed
    1. Rödel, B., T. Wagner, M. Zörnig, J. Niessing, and T. Möröy. 1998. The human homologue (GFI1B) of the chicken GFI gene maps to chromosome 9q34.13-A locus frequently altered in hematopoietic diseases. Genomics. 54:580–582. - PubMed
    1. Grimes, H.L., T.O. Chan, P.A. Zweidler-McKay, B. Tong, and P.N. Tsichlis. 1996. The Gfi-1 proto-oncoprotein contains a novel transcriptional repressor domain, SNAG, and inhibits G1 arrest induced by interleukin-2 withdrawal. Mol. Cell. Biol. 16:6263–6272. - PMC - PubMed
    1. Zweidler-Mckay, P.A., H.L. Grimes, M.M. Flubacher, and P.N. Tsichlis. 1996. Gfi-1 encodes a nuclear zinc finger protein that binds DNA and functions as a transcriptional repressor. Mol. Cell. Biol. 16:4024–4034. - PMC - PubMed
    1. Rödel, B., K. Tavassoli, H. Karsunky, T. Schmidt, M. Bachmann, F. Schaper, P. Heinrich, K. Shuai, H.P. Elsasser, and T. Möröy. 2000. The zinc finger protein Gfi-1 can enhance STAT3 signaling by interacting with the STAT3 inhibitor PIAS3. EMBO J. 19:5845–5855. - PMC - PubMed

Publication types

MeSH terms