. 2003 Apr 7;197(7):907-18.
doi: 10.1084/jem.20021366.

CD1d-expressing dendritic cells but not thymic epithelial cells can mediate negative selection of NKT cells

Affiliations

CD1d-expressing dendritic cells but not thymic epithelial cells can mediate negative selection of NKT cells

Taehoon Chun et al. J Exp Med. .

Abstract

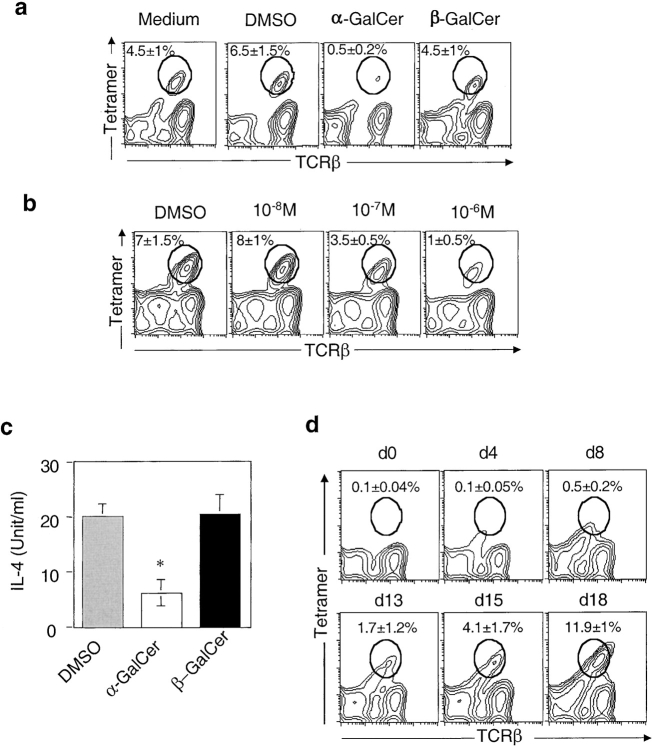
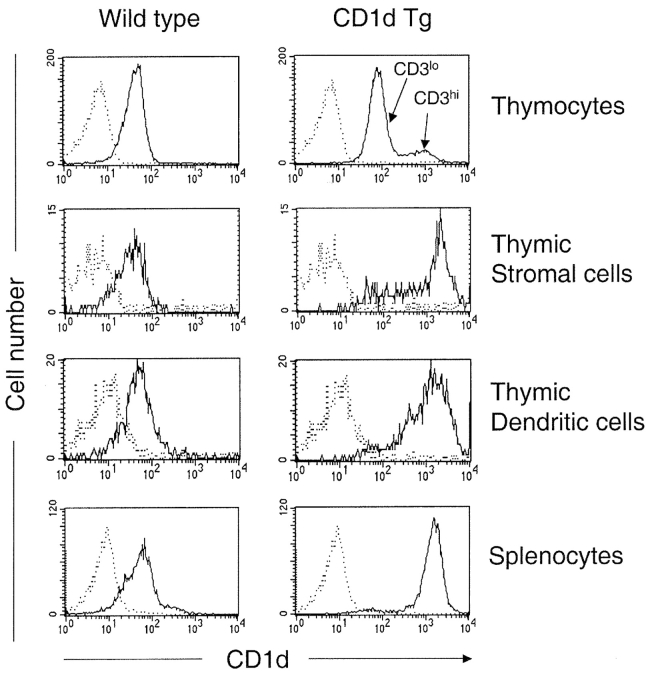
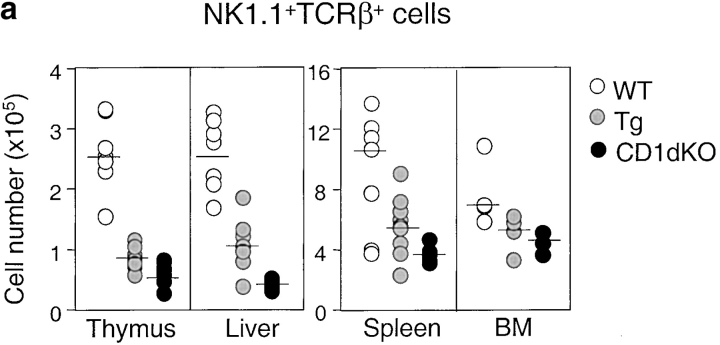
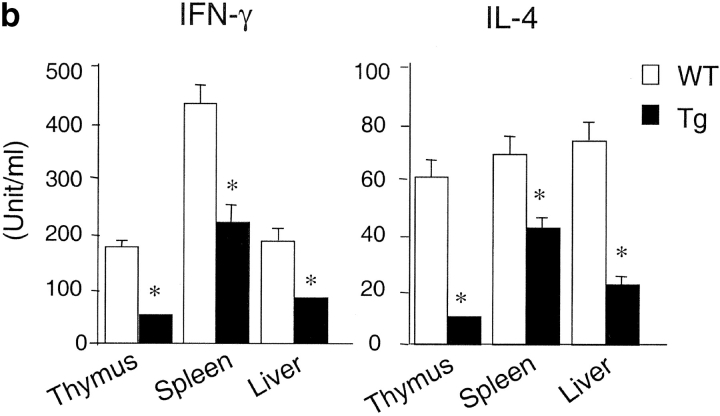
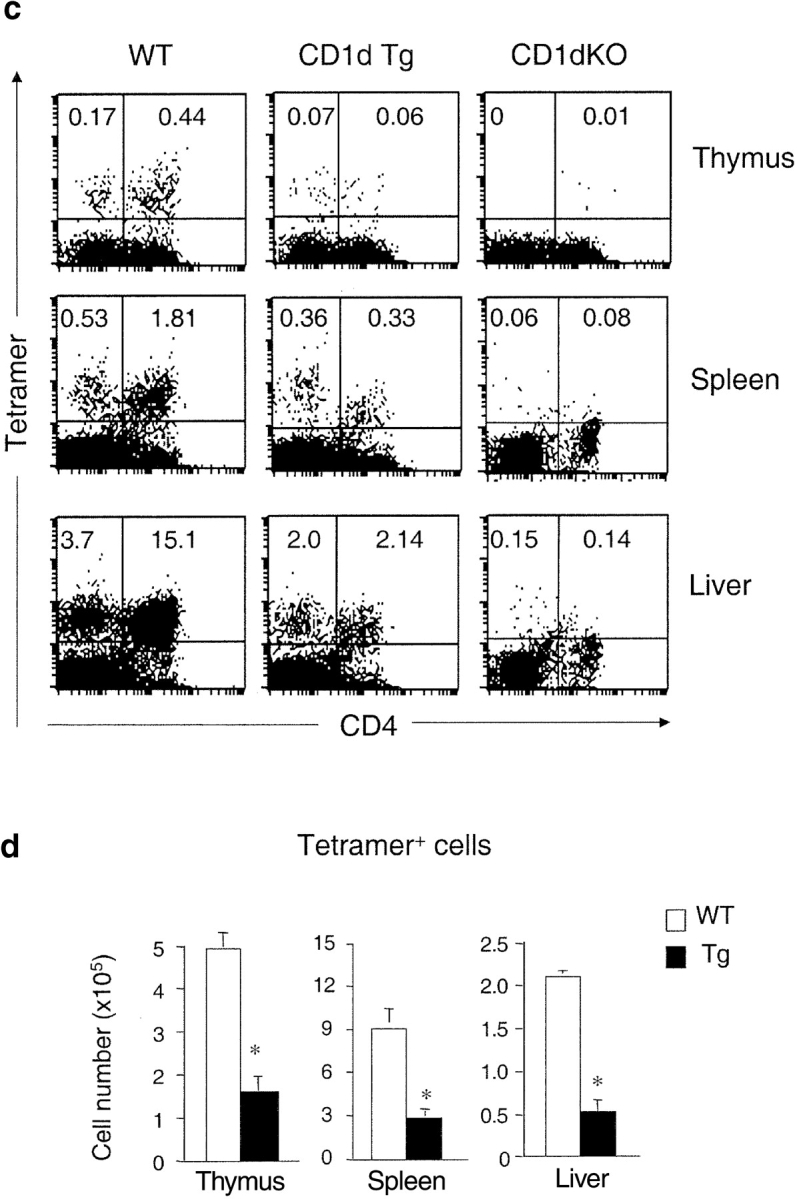
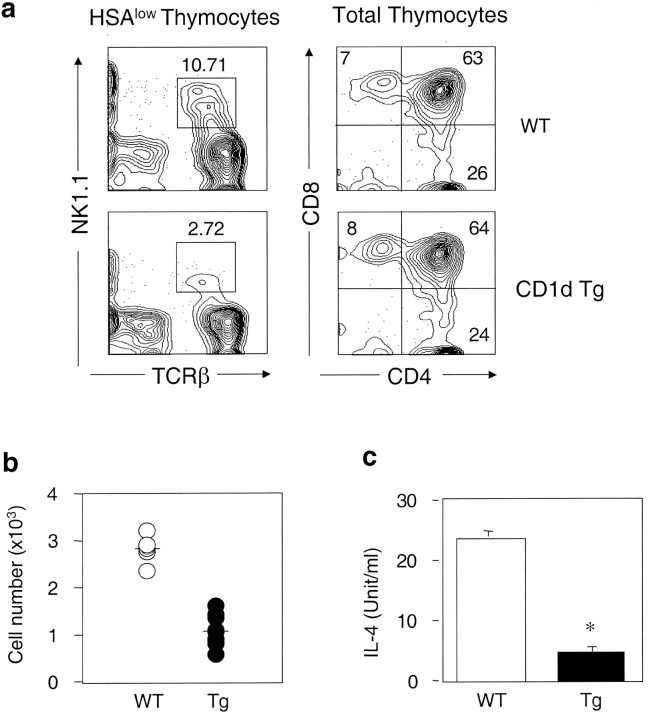
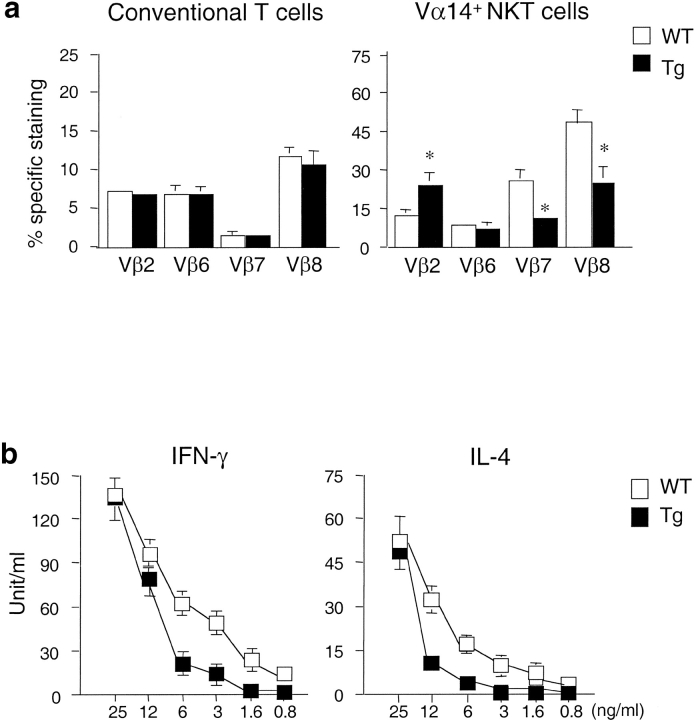
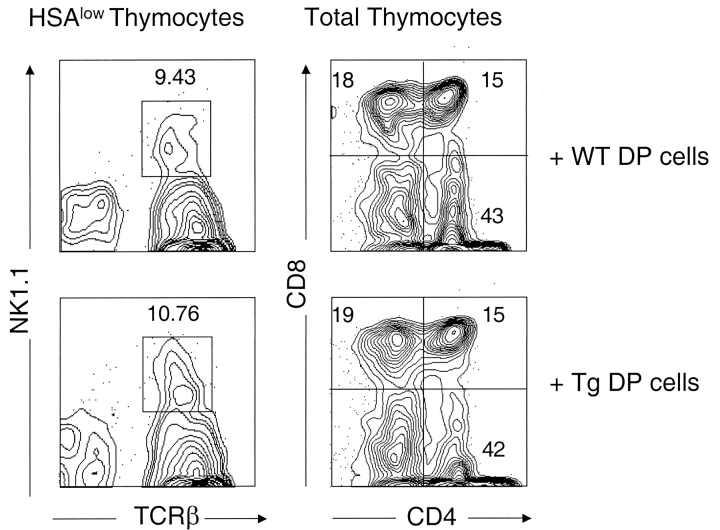
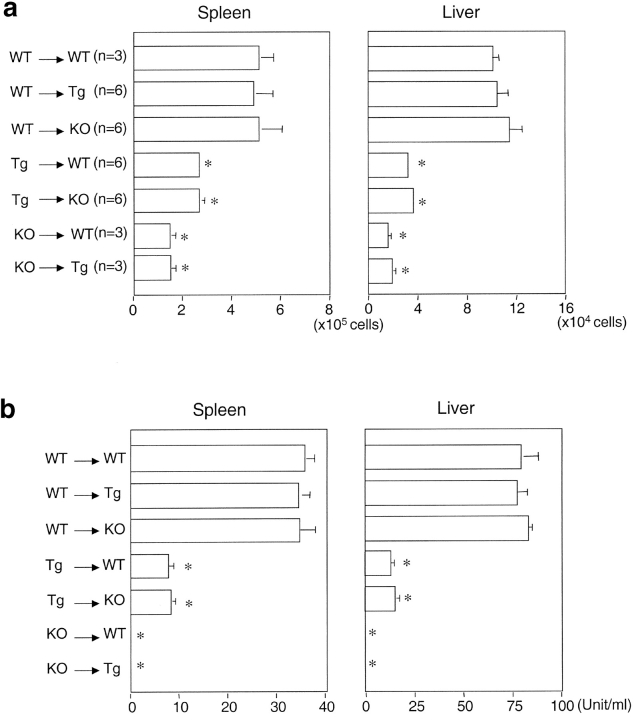
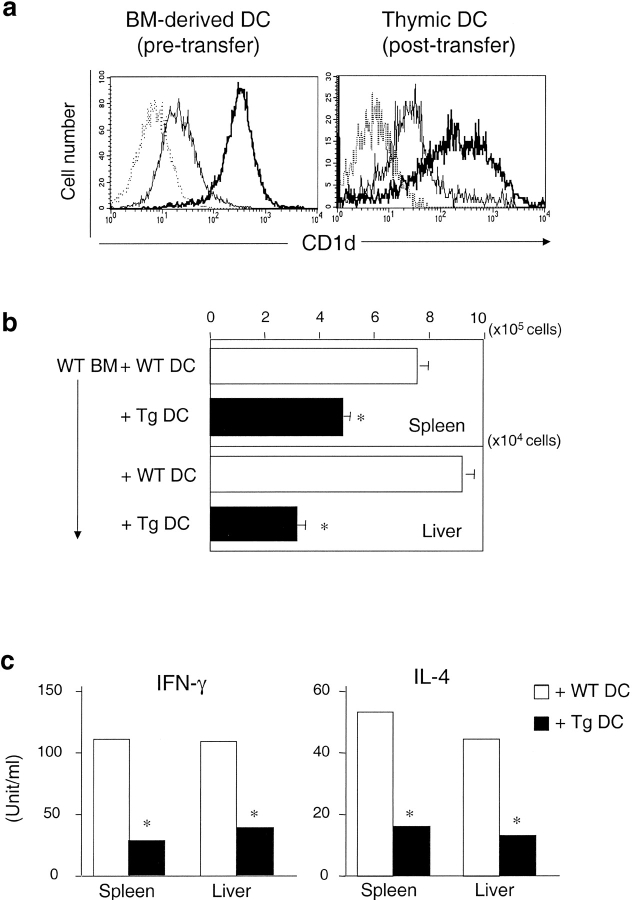
Natural killer T (NKT) cells are a unique immunoregulatory T cell population that is positively selected by CD1d-expressing thymocytes. Previous studies have shown that NKT cells exhibit autoreactivity, which raises the question of whether they are subject to negative selection. Here, we report that the addition of agonist glycolipid alpha-galactosylceramide (alpha-GalCer) to a fetal thymic organ culture (FTOC) induces a dose-dependent disappearance of NKT cells, suggesting that NKT cells are susceptible to negative selection. Overexpression of CD1d in transgenic (Tg) mice results in reduced numbers of NKT cells, and the residual NKT cells in CD1d-Tg mice exhibit both an altered Vbeta usage and a reduced sensitivity to antigen. Furthermore, bone marrow (BM) chimeras between Tg and WT mice reveal that CD1d-expressing BM-derived dendritic cells, but not thymic epithelial cells, mediate the efficient negative selection of NKT cells. Thus, our data suggest that NKT cells developmentally undergo negative selection when engaged by high-avidity antigen or abundant self-antigen.


Figures

Figure 1.
Figure 1.
CD1d-restricted NKT cell development is decreased in α-GalCer-treated thymic lobes. (a) Thymic lobes were harvested from gestational day 15 B6 mice and incubated with solvent (0.1% DMSO), α-GalCer (10−6 M), or β-GalCer (10−6 M). After 18 d of culture, thymocytes were harvested and stained with FITC-anti-TCRβ and PE-CD1d/α-GalCer tetramers. The plots are representative of three experiments involving a total of 4 thymic lobes for each condition, with the percentage of tetramer+ cells indicated. No significant differences in the total number of thymocytes were observed between α-GalCer–treated lobes and controls. In addition, α-GalCer treatment did not affect the levels of CD1d surface expression. (b) Thymic lobes were incubated with α-GalCer at indicated concentrations, and the numbers of tetramer+ cells were analyzed by flow cytometry. Representative data from one of two experiments are shown. (c) Thymocytes from each treated group (n = 4) were pooled and stimulated with plate-bound anti-CD3 (2C11, 10 μg/ml) for 48 h. The amount of IL-4 secretion was determined by sandwich ELISA. (d) α-GalCer (10−6 M) was added to FTOC at different time points after the beginning of the culture. After 20 d, thymic lobes were harvested and analyzed by flow cytometry for the presence of tetramer+ cells. Representative data from one of two experiments are shown.
Figure 2.
Figure 2.
CD1d expression in Kb-mCD1d1 transgenic (CD1d Tg) mice. Flow cytometric analysis of cell surface expression of CD1d in WT control and Tg mice. Cells were stained with FITC-anti-CD1d mAb (5C6) and PE-conjugated anti-CD3, anti-CD11c, and anti-I-Ab. Specific fluorescence profiles (thin line) obtained with anti-CD1d were overlayed onto background profiles (dotted line) obtained with isotype control Ab (hamster anti-TNP). Similar results were obtained with the other anti-CD1d mAb, 3H3 (unpublished data). Results are representative of two separate experiments.
Figure 3.
Figure 3.
The number of NKT cells and cytokine production capacity are reduced in CD1d Tg mice. (a) Lymphocytes isolated from thymus, spleen, and liver of indicated mice were stained with FITC-anti-TCRβ and PE-anti-NK1.1 and analyzed by flow cytometry. The absolute number of NKT cells was calculated by percentage of NK1.1+ T cells x total number of cells. Circles represent number of NKT cells from indicated tissues, and the horizontal bar denotes the mean value. (b) Reduced cytokine production by NKT cells from Tg mice in response to α-GalCer. Lymphocytes from WT (n = 5) and Tg (n = 5) were cultured in the presence of α-GalCer for 48 h. IL-4 and IFN-γ levels in the supernatant were detected by ELISA. Lymphocytes from CD1dKO mice did not produce detectable amounts of cytokines upon α-GalCer stimulation. (c) The number of CD1d/α−GalCer tetramer+ cells is reduced in Tg mice. Lymphocytes from WT, Tg, and CD1dKO mice were stained with APC conjugated-CD1d/α-GalCer tetramers, FITC-anti-CD4, and PE-anti-CD8 and analyzed by flow cytometry. Results are representative of three experiments. (d) Compared with WT mice, the absolute number of CD1d/α-GalCer tetramer+ cells in thymus, spleen and liver of Tg mice are significantly diminished. Data shown represent mean ± SE of seven mice in each group.
Figure 3.
Figure 3.
The number of NKT cells and cytokine production capacity are reduced in CD1d Tg mice. (a) Lymphocytes isolated from thymus, spleen, and liver of indicated mice were stained with FITC-anti-TCRβ and PE-anti-NK1.1 and analyzed by flow cytometry. The absolute number of NKT cells was calculated by percentage of NK1.1+ T cells x total number of cells. Circles represent number of NKT cells from indicated tissues, and the horizontal bar denotes the mean value. (b) Reduced cytokine production by NKT cells from Tg mice in response to α-GalCer. Lymphocytes from WT (n = 5) and Tg (n = 5) were cultured in the presence of α-GalCer for 48 h. IL-4 and IFN-γ levels in the supernatant were detected by ELISA. Lymphocytes from CD1dKO mice did not produce detectable amounts of cytokines upon α-GalCer stimulation. (c) The number of CD1d/α−GalCer tetramer+ cells is reduced in Tg mice. Lymphocytes from WT, Tg, and CD1dKO mice were stained with APC conjugated-CD1d/α-GalCer tetramers, FITC-anti-CD4, and PE-anti-CD8 and analyzed by flow cytometry. Results are representative of three experiments. (d) Compared with WT mice, the absolute number of CD1d/α-GalCer tetramer+ cells in thymus, spleen and liver of Tg mice are significantly diminished. Data shown represent mean ± SE of seven mice in each group.
Figure 4.
Figure 4.
Impaired NKT cell development in CD1d Tg fetal thymic lobes. (a) Thymic lobes from both Tg (n = 10) and littermate control mice (n = 5) were harvested on gestational day 16.5. After 10 d of culture, thymocytes were stained with either FITC-anti-HAS, CyChrome-anti-TCRβ, and PE-anti-NK1.1; or FITC-anti-CD4 and PE-anti-CD8α. The percentage of NKT cells in HSAlow gated population, and the percentage CD4+, CD8+, and DP thymocytes are shown from a representative experiment. (b) Decreased total number of NKT cells in Tg thymic lobes. Circles represent pairs of thymic lobes, and the horizontal bar denotes the mean value. (c) Thymocytes from Tg and control thymic lobes were pooled and stimulated with anti-CD3 (2C11, 10 μg/ml) for 48 h. The amount of IL-4 secretion was determined by sandwich ELISA.
Figure 5.
Figure 5.
Altered Vβ usage and affinity to α-GalCer of CD1d-restricted NKT cells in CD1d Tg mice. (a) Splenocytes from indicated mice were stained with APC conjugated-CD1d/α-GalCer tetramer, PE-anti-TCRβ, and FITC-anti-Vβ2, Vβ6, Vβ7, and Vβ8. Percentage of Vβ usage was calculated within gated TCRβ+ cells (conventional T cells) and CD1d/α-GalCer tetramer+ cells (Vα14+ cells). Data shown represent mean ± SE of four mice in each group. (b) Reduced cytokine production by CD1d/α-GalCer tetramer+ cells from CD1d Tg mice in response to α-GalCer. 2 × 10⁴ tetramer+ cells from CD1d Tg and WT mice were cultured in the presence of various concentration of α-GalCer for 48 h. IL-4 and IFN-γ levels in the supernatant were detected by ELISA. Results are representative of two separate experiments.
Figure 6.
Figure 6.
Thymic stromal cells are required for the negative selection of NKT cells. Reaggregate thymic organ cultures were made from equal numbers of WT thymic epithelial cells and either DP thymocytes from WT (top panel) or Tg mice (bottom panel). Cultures were harvested after 5 d and analyzed by flow cytometry for the development of NKT cells and various thymocyte subsets. The percentage of NKT cells in HSAlow gated population, and the percentage CD4+, CD8+, and DP thymocytes are indicated from a representative experiment. Similar results were obtained from two separate experiments.
Figure 7.
Figure 7.
CD1d expressed on bone marrow–derived cells are critical for the negative selection of NKT cells. 107 bone marrow-derived cells from WT, Tg, and CD1dKO mice were transferred into lethally irradiated recipient mice (980 rad) by intravenous injection. After 10 wk, spleen and liver lymphocytes from bone marrow chimera were isolated and analyzed by flow cytometry. (a) Absolute NKT cell numbers of liver lymphocytes and splenocytes from each group of bone marrow chimeras. (b) IL-4 production by liver lymphocytes and splenocytes from each group of bone marrow chimeras. 106 liver lymphocytes and splenocytes from indicated group of mice were cultured in the presence of 100 ng/ml of α-GalCer for 48 h. IL-4 levels in the supernatant were detected by ELISA.
Figure 8.
Figure 8.
DCs can mediate the negative selection of NKT cells. 107 bone marrow–derived cells from WT mice and 3.3 × 10⁶ DCs (CD11c+) from either WT or CD1dTg mice were cotransferred to irradiated RAG-deficient mice (700 rad) by intravenous injection. After 10 wk, spleen and liver lymphocytes from chimera were isolated and analyzed by flow cytometry. (a) Flow cytometry analysis of CD1d expression on bone marrow-derived DCs (CD11c+, greater than 80% are CD11b+CD8) from donor mice and thymic DCs (CD11c+, ∼50–60% CD11b+CD8, ∼30–40% CD11bCD8+) from reconstituted mice. The levels of CD1d expression on bone marrow–derived DCs from Tg animals is ∼10–20 fold higher than those of WT controls. Specific fluorescence profiles (thin line: WT DCs and thick line: Tg DCs) obtained with anti-CD1d (5C6) were overlayed onto background profiles (dotted line) obtained with isotype control Ab. (b) Absolute NKT cell numbers of liver lymphocytes and splenocytes from each group of chimeras. The absolute number of NKT cells was calculated by percentage of NKT cells × total number of cells. Data shown represent mean ± SE of three mice in each group. (c) Cytokine production by NKT cells of liver lymphocytes and splenocytes from each group of chimeras was determined as described in Fig. 7.

Similar articles

Cited by

References

    1. MacDonald, H.R. 1995. NK1.1+ T cell receptor-α/β+ cells: New clues to their origin, specificity, and function. J. Exp. Med. 182:633–638. - PMC - PubMed
    1. Bendelac, A., M.N. Rivera, S.H. Park, and J.H. Roark. 1997. Mouse CD1-specific NK1 T cells: development, specificity, and function. Annu. Rev. Immunol. 15:535–562. - PubMed
    1. Eberl, G., R. Lees, S.T. Smiley, M. Taniguchi, M.J. Grusby, and H.R. MacDonald. 1999. Tissue-specific segregation of CD1d-dependent and CD1d-independent NK T cells. J. Immunol. 162:6410–6419. - PubMed
    1. Hammond, K.J., S.B. Pelikan, N.Y. Crowe, E. Randle-Barrett, T. Nakayama, M. Taniguchi, M.J. Smyth, I.R. van Driel, R. Scollay, A.G. Baxter, and D.I. Godfrey. 1999. NKT cells are phenotypically and functionally diverse. Eur. J. Immunol. 29:3768–3781. - PubMed
    1. Arase, H., N. Arase, K. Ogasawara, R.A. Good, and K. Onoe. 1992. An NK1.1+ CD4+CD8- single-positive thymocyte subpopulation that expresses a highly skewed T cell antigen receptor family. Proc. Natl. Acad. Sci. USA. 89:6506–6510. - PMC - PubMed

Publication types