. 2003 Apr;2(2):362-79.
doi: 10.1128/EC.2.2.362-379.2003.

Molecular map of the Chlamydomonas reinhardtii nuclear genome

Affiliations

Molecular map of the Chlamydomonas reinhardtii nuclear genome

Pushpa Kathir et al. Eukaryot Cell. 2003 Apr.

Abstract

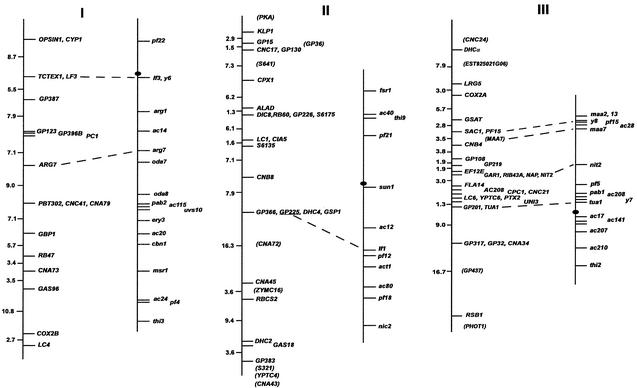
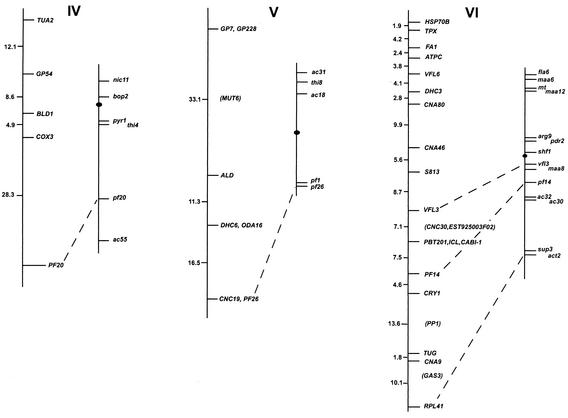
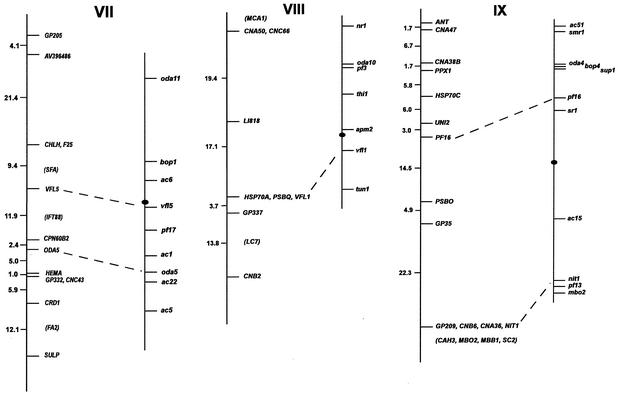
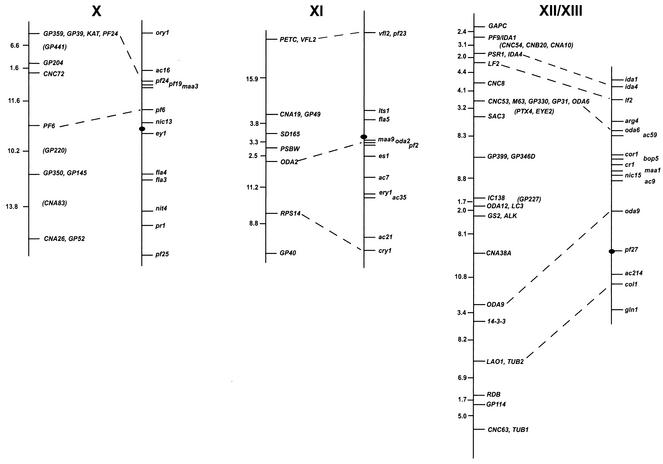
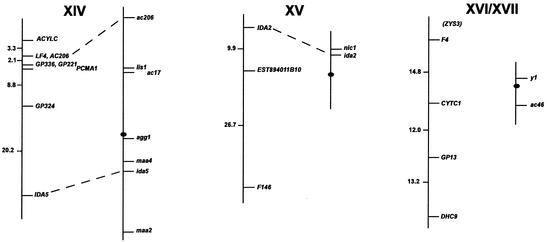
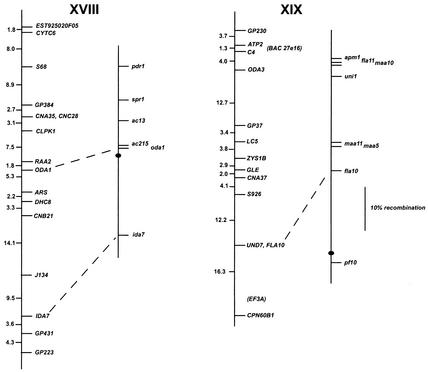
We have prepared a molecular map of the Chlamydomonas reinhardtii genome anchored to the genetic map. The map consists of 264 markers, including sequence-tagged sites (STS), scored by use of PCR and agarose gel electrophoresis, and restriction fragment length polymorphism markers, scored by use of Southern blot hybridization. All molecular markers tested map to one of the 17 known linkage groups of C. reinhardtii. The map covers approximately 1,000 centimorgans (cM). Any position on the C. reinhardtii genetic map is, on average, within 2 cM of a mapped molecular marker. This molecular map, in combination with the ongoing mapping of bacterial artificial chromosome (BAC) clones and the forthcoming sequence of the C. reinhardtii nuclear genome, should greatly facilitate isolation of genes of interest by using positional cloning methods. In addition, the presence of easily assayed STS markers on each arm of each linkage group should be very useful in mapping new mutations in preparation for positional cloning.


Figures

FIG. 1.
FIG. 1.
Chlamydomonas molecular and genetic maps. For each of the 17 linkage groups, the genetic map (adapted from the work of Harris [46]) is shown on the right, with the centromere represented by the black oval, and the molecular map is shown on the left. For genetic maps, spaces between markers represent recombination units (percent recombination); the scale bar is to the right of the maps for linkage group XIX. For molecular maps, numbers to the left of the vertical line indicate centimorgans (Kosambi units). The order of molecular markers placed on the map is predicted to be accurate with a Lod score of at least 2.0 by use of MAPMAKER/QTL 3.0 (78). For markers that could not be ordered with a Lod score of at least 2.0, the “try” command was used to determine the most likely map position. Such markers are enclosed in parentheses. For markers separated by commas on the same line, the order was indistinguishable by recombination. Dashed lines connecting the genetic and molecular maps indicate a molecular marker corresponding directly to a previously mapped phenotypic marker. The orientation of the molecular map with respect to the genetic map has not been confirmed for linkage groups VIII, XV, and XVI/XVII. Further information on the markers is available at http://www.biology.duke.edu/chlamydb/.
FIG. 1.
FIG. 1.
Chlamydomonas molecular and genetic maps. For each of the 17 linkage groups, the genetic map (adapted from the work of Harris [46]) is shown on the right, with the centromere represented by the black oval, and the molecular map is shown on the left. For genetic maps, spaces between markers represent recombination units (percent recombination); the scale bar is to the right of the maps for linkage group XIX. For molecular maps, numbers to the left of the vertical line indicate centimorgans (Kosambi units). The order of molecular markers placed on the map is predicted to be accurate with a Lod score of at least 2.0 by use of MAPMAKER/QTL 3.0 (78). For markers that could not be ordered with a Lod score of at least 2.0, the “try” command was used to determine the most likely map position. Such markers are enclosed in parentheses. For markers separated by commas on the same line, the order was indistinguishable by recombination. Dashed lines connecting the genetic and molecular maps indicate a molecular marker corresponding directly to a previously mapped phenotypic marker. The orientation of the molecular map with respect to the genetic map has not been confirmed for linkage groups VIII, XV, and XVI/XVII. Further information on the markers is available at http://www.biology.duke.edu/chlamydb/.

Similar articles

Cited by

References

    1. Adair, W. S., and W. J. Snell. 1990. The Chlamydomonas cell wall: structure, biochemistry, and molecular biology, p. 15-84. In R. P. Mecham and W. S. Adair (ed.), Matrix organization and assembly of plant and animal extracellular matrix. Academic Press, Orlando, Fla.
    1. Asamizu, E., K. Miura, K. Kucho, Y. Inoue, H. Fukuzawa, K. Ohyama, Y. Nakamura, and S. Tabata. 2000. Generation of expressed sequence tags from low-CO2 and high-CO2 adapted cells of Chlamydomonas reinhardtii. DNA Res. 7:305-307. - PubMed
    1. Ball, S. G. 1998. Regulation of starch biosynthesis, p. 549-567. In J.-D. Rochaix, M. Goldschmidt-Clermont, and S. Merchant (ed.), The molecular biology of chloroplasts and mitochondria in Chlamydomonas. Kluwer Academic Publishers, Dordrecht, The Netherlands.
    1. Benashski, S. E., R. S. Patel-King, and S. M. King. 1999. Light chain 1 from Chlamydomonas outer dynein arm is a leucine-rich repeat protein associated with the motor domain of the gamma heavy chain. Biochemistry 38:7253-7264. - PubMed
    1. Bendall, D. S., M. Sanguansermsri, J. Girard-Bascou, and P. Bennoun. 1986. Mutations of Chlamydomonas reinhardtii affecting the cytochrome bf complex. FEBS Lett. 203:31-35.

Publication types

Substances

LinkOut - more resources