

Disruption of glial glutamate transport by reactive oxygen species produced in motor neurons
- PMID: 12684448
- PMCID: PMC6742077
- DOI: 10.1523/JNEUROSCI.23-07-02627.2003
Disruption of glial glutamate transport by reactive oxygen species produced in motor neurons
Abstract
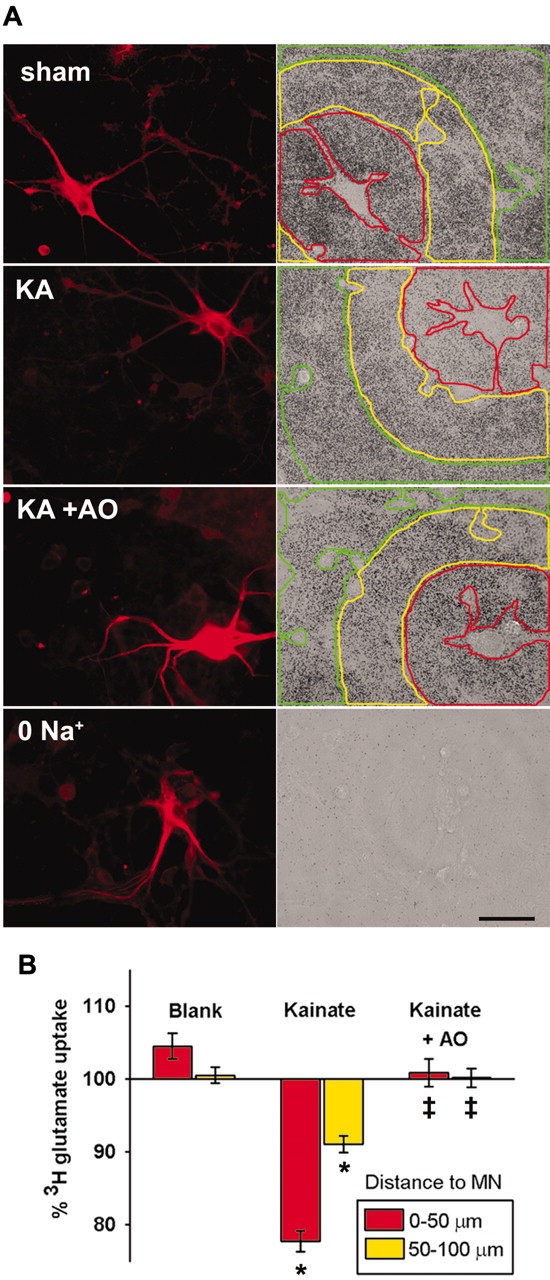
Observations of elevated CSF glutamate in amyotrophic lateral sclerosis (ALS), together with findings that motor neurons are selectively vulnerable to glutamate receptor-mediated ("excitotoxic") injury, support an excitotoxic contribution to the motor neuron loss in the disease. However, the basis of the apparent loss of astrocytic glutamate transport capacity in affected areas of motor cortex and spinal cord, which probably underlies the extracellular glutamate elevations, is unexplained. Here, we find that glutamate induces far greater reactive oxygen species (ROS) generation in cultured motor neurons than in other spinal neurons. In addition, we found that the ROS seem to be able to leave the motor neurons and induce oxidation and disruption of glutamate uptake in neighboring astrocytes. Correspondingly, in a transgenic mouse model of ALS, protein oxidation was increased in regions immediately surrounding motor neurons. These results provide a mechanism that can account for the localized loss of glial glutamate transport seen in the disease. Furthermore, the observations lend support for a feedforward model involving reciprocal interactions between motor neurons and glia, which may prove useful in understanding ALS pathogenesis.
Figures
Similar articles
-
Astrocytic production of nerve growth factor in motor neuron apoptosis: implications for amyotrophic lateral sclerosis.J Neurochem. 2004 Apr;89(2):464-73. doi: 10.1111/j.1471-4159.2004.02357.x. J Neurochem. 2004. PMID: 15056289
-
Motor neuron impairment mediated by a sumoylated fragment of the glial glutamate transporter EAAT2.Glia. 2011 Nov;59(11):1719-31. doi: 10.1002/glia.21218. Epub 2011 Jul 18. Glia. 2011. PMID: 21769946 Free PMC article.
-
Knocking down metabotropic glutamate receptor 1 improves survival and disease progression in the SOD1(G93A) mouse model of amyotrophic lateral sclerosis.Neurobiol Dis. 2014 Apr;64:48-59. doi: 10.1016/j.nbd.2013.11.006. Epub 2013 Dec 19. Neurobiol Dis. 2014. PMID: 24361555
-
A role for astrocytes in motor neuron loss in amyotrophic lateral sclerosis.Brain Res Brain Res Rev. 2004 Dec;47(1-3):263-74. doi: 10.1016/j.brainresrev.2004.05.003. Brain Res Brain Res Rev. 2004. PMID: 15572176 Review.
-
Implications for soluble iron accumulation, oxidative stress, and glial glutamate release in motor neuron death associated with sporadic amyotrophic lateral sclerosis.Neuropathology. 2025 Jun;45(3):177-201. doi: 10.1111/neup.13033. Epub 2025 Mar 10. Neuropathology. 2025. PMID: 40065552 Free PMC article. Review.
Cited by
-
P2X7 Receptor Antagonism as a Potential Therapy in Amyotrophic Lateral Sclerosis.Front Mol Neurosci. 2020 Jun 12;13:93. doi: 10.3389/fnmol.2020.00093. eCollection 2020. Front Mol Neurosci. 2020. PMID: 32595451 Free PMC article. Review.
-
The Key Role of Astrocytes in Amyotrophic Lateral Sclerosis and Their Commitment to Glutamate Excitotoxicity.Int J Mol Sci. 2023 Oct 21;24(20):15430. doi: 10.3390/ijms242015430. Int J Mol Sci. 2023. PMID: 37895110 Free PMC article. Review.
-
Experimental models for the study of neurodegeneration in amyotrophic lateral sclerosis.Mol Neurodegener. 2009 Jul 20;4:31. doi: 10.1186/1750-1326-4-31. Mol Neurodegener. 2009. PMID: 19619317 Free PMC article.
-
Marked synergism between mutant SOD1 and glutamate transport inhibition in the induction of motor neuronal degeneration in spinal cord slice cultures.Brain Res. 2012 Apr 11;1448:153-62. doi: 10.1016/j.brainres.2012.02.005. Epub 2012 Feb 9. Brain Res. 2012. PMID: 22370146 Free PMC article.
-
Investigating the metabolic changes due to visual stimulation using functional proton magnetic resonance spectroscopy at 7 T.J Cereb Blood Flow Metab. 2012 Aug;32(8):1484-95. doi: 10.1038/jcbfm.2012.33. Epub 2012 Mar 21. J Cereb Blood Flow Metab. 2012. PMID: 22434070 Free PMC article.
References
-
- Abe K, Pan LH, Watanabe M, Kato T, Itoyama Y. Induction of nitrotyrosine-like immunoreactivity in the lower motor neuron of amyotrophic lateral sclerosis. Neurosci Lett. 1995;199:152–154. - PubMed
-
- Aeschbacher M, Reinhardt CA, Zbinden G. A rapid cell membrane permeability test using fluorescent dyes and flow cytometry. Cell Biol Toxicol. 1986;2:247–255. - PubMed
-
- Alexander GM, Deitch JS, Seeburger JL, Del Valle L, Heiman-Patterson TD. Elevated cortical extracellular fluid glutamate in transgenic mice expressing human mutant (G93A) Cu/Zn superoxide dismutase. J Neurochem. 2000;74:1666–1673. - PubMed
-
- Alexianu ME, Ho BK, Mohamed AH, La Bella V, Smith RG, Appel SH. The role of calcium-binding proteins in selective motoneuron vulnerability in amyotrophic lateral sclerosis. Ann Neurol. 1994;36:846–858. - PubMed
-
- Beal MF, Ferrante RJ, Browne SE, Matthews RT, Kowall NW, Brown RH., Jr Increased 3-nitrotyrosine in both sporadic and familial amyotrophic lateral sclerosis. Ann Neurol. 1997;42:644–654. - PubMed
Publication types
MeSH terms
Substances
Grants and funding
LinkOut - more resources
Full Text Sources
Other Literature Sources
Miscellaneous