. 2003 Apr 1;23(7):2645-54.
doi: 10.1523/JNEUROSCI.23-07-02645.2003.

Different circuits for ON and OFF retinal ganglion cells cause different contrast sensitivities

Affiliations

Different circuits for ON and OFF retinal ganglion cells cause different contrast sensitivities

Kareem A Zaghloul et al. J Neurosci. .

Abstract

The theory of "parallel pathways" predicts that, except for a sign reversal, ON and OFF ganglion cells are driven by a similar presynaptic circuit. To test this hypothesis, we measured synaptic inputs to ON and OFF cells as reflected in the subthreshold membrane potential. We made intracellular recordings from brisk-transient (Y) cells in the in vitro guinea pig retina and show that ON and OFF cells in fact express significant asymmetries in their synaptic inputs. An ON cell receives relatively linear input that modulates a single excitatory conductance; whereas an OFF cell receives rectified input that modulates both inhibitory and excitatory conductances. The ON pathway, blocked by L-AP-4, tonically inhibits an OFF cell at mean luminance and phasically inhibits an OFF cell during a light increment. Our results suggest that basal glutamate release is high at ON but not OFF bipolar terminals, and inhibition between pathways is unidirectional: ON --> OFF. These circuit asymmetries explain asymmetric contrast sensitivity observed in spiking behavior.


Figures

Fig. 1.
Fig. 1.
White noise stimulation and analysis.A, A spot covering the receptive field center of a cell modulated with intensities drawn from a Gaussian distribution (white noise; 16.7 msec frame). The top trace shows 300 msec of baseline response followed by 1 sec of white noise response. Thebottom trace shows the 1 sec white noise response after removing spikes and filtering (see Materials and Methods).B, An L–NL model was used to analyze the response to white noise. Stimulus is convolved with a L filter to generate an L model of the response. The L model is passed through a static nonlinearity to generate an L–NL model of the response. The L filter reflects the temporal sensitivity of a cell; the NL function reflects the contrast sensitivity of a cell (see Results). Analysis was performed separately for subthreshold voltages (membrane) and spike rate (spikes). For comparison with the L–NL model, membrane and spike traces are average responses to 20 repeats (averaged to reduce noise; 700 msec shown of a 5 sec stimulus presentation). Filter units are in millivolt contrast per second (membrane filter) or spike rate contrast per second (spike filter). sp, Spikes.
Fig. 2.
Fig. 2.
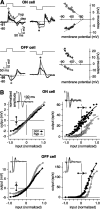
Relative to an ON cell, an OFF cell receives more rectified synaptic input and transmits more rectified spike output.A, Membrane L filter and NL function for representative cells and the populations. The NL function of the ON cell reaches positive and negative amplitudes of similar extents, whereas that of the OFF cell reaches a maximum negative amplitude that is only half the maximum positive amplitude (i.e., rectification). For the L filter, response amplitude is normalized to the peak of the primary lobe (+1 for ON and –1 for OFF). For the NL input–output function, input is normalized from –1 to + 1; output is normalized so that the predicted response at 0 contrast is 0, and the maximum depolarization is 1. For single-cell NL functions, circles represent binned data points; the solid line represents a fit (see Materials and Methods). The shaded area around the average NL function represents ±SEM. An ON cell was slightly but significantly more biphasic (amplitude of peak to undershoot) than an OFF cell for both spike and membrane responses (p<0.05). B, Same format as in A for spikes. At low contrast (i.e., small values of input), an ON cell is nearly linear, whereas an OFF cell is strongly rectified. For both an ON and OFF cell, the spike L filter was more biphasic than the membrane L filter (p <0.01), consistent with high-pass filtering (Lankheet et al., 1989; Demb et al., 2001b).C, Population NL input–output functions plotted with raw response amplitudes (output). For both membrane and spikes, an OFF cell expresses a wider response range than an ON cell (p < 0.01). D, For both membrane and spikes, the NL index was significantly higher for OFF cells (p < 0.001). The scatter plot illustrates a significant correlation between the membrane and spike NL indices (p < 0.01). NL index of0 indicates a linear response.
Fig. 3.
Fig. 3.
Response to a brief flash confirms that an OFF cell rectifies more than an ON cell. A, Flash response of a representative ON and OFF cell. Traces attop show the membrane response to light flashes increasing to twice the mean luminance (thin lines) and dark flashes decreasing to 0 (thick lines). Poststimulus time histograms at bottom show the corresponding spike response. The contrast–response function of each cell is shown (inset, responses averaged over a 33–50 msec time window indicated by the gray stripe; average of 15 flashes for both cells; stimulus was a 500-μm-diameter spot).B, Population contrast–response functions for normalized membrane potential and spike rate (mean ± SEM). Responses were normalized to the peak depolarization or spike rate. For comparison, population NL functions from Figure 2 are superimposed (line with shaded area).sp, Spikes.
Fig. 4.
Fig. 4.
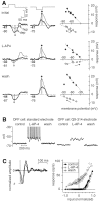
Mechanism for inhibition is indirect for an ON cell but direct for an OFF cell. A, Response to a 100 msec flash of positive (1.0) or negative (–1.0) contrast was measured while injecting steady hyperpolarizing (hyp) or depolarizing (dep) current. The baseline membrane potential is plotted versus the peak of the depolarizing light response or the trough of the hyperpolarizing light response (averaged over 10 msec; gray stripe). For the ON cell, both the depolarizing response and hyperpolarizing response have apparent reversal positive to Vrest (approximately –20 mV). For the OFF cell, the depolarizing response reverses positive to Vrest (–40 mV), whereas the hyperpolarizing response reverses negative to Vrest (–100 mV).Numbers below the trace indicate membrane potential (in millivolts) before the stimulus in the depolarized (bold) and hyperpolarized condition. Dashed lines indicate linear regression. For the OFF cell, the recording electrode contained QX-314. B, White noise response was measured in a control condition (con) or while injecting steady hyperpolarizing current (hyp). For membrane NL function, the arrow indicates the direction of the effect of hyperpolarizing current on the hyperpolarizing light response (negative values of input axis). The effect of hyperpolarizing current on the membrane NL function was consistent with indirect inhibition in an ON cell but direct inhibition in an OFF cell (see Results). For the OFF cell, the control curve was measured with depolarizing current to enhance the effect of hyperpolarizing current. In both cells, hyperpolarizing current caused a rightward shift in the spike NL function, increasing output rectification.Insets show the corresponding L filter, which was normalized after injecting current to match the control peak amplitude (see Mateials and Methods). sp, Spikes.
Fig. 5.
Fig. 5.
Evidence that the hyperpolarizing response of an ON cell depends on high basal glutamate release. Thetrace shows 500 msec of mean luminance followed by 1.5 cycles of a step response (full contrast). Initially (39 s), l-AP-4 reduced the membrane variance at mean luminance and eliminated the hyperpolarizing response to dark (h). Next (48 s),l-AP-4 eliminated the depolarizing response to light. The recovery during wash was in the opposite order; first (46 s) the depolarizing response recovered, and then (133 s) the variance increased, and the hyperpolarizing response returned. Apparently the hyperpolarizing response depends on basal glutamate release (which causes increased membrane variance at mean luminance) so that an excitatory signal can be withdrawn. The recording electrode contained QX-314 so that membrane variance could be assessed independent of spiking.
Fig. 6.
Fig. 6.
The ON pathway inhibits an OFF cell phasically to a light flash and tonically at mean luminance. A, The response of an OFF cell was measured to a 100 msec bright or dark spot (full contrast). Initially, the hyperpolarizing (hyp) response had an apparent reversal negative to Vrest(approximately –100 mV). During l-AP-4, the hyperpolarizing response was altered; it became smaller and had an apparent reversal positive to Vrest (∼0 mV). The effect of l-AP-4 reversed after washing. In all three conditions, the depolarizing (dep) response had similar apparent reversal (between –30 and –20 mV). Lines indicate a linear regression. The leftward point for the depolarizing response was not included in the fit; at the most hyperpolarized point, the depolarizing response to dark was delayed, so the amplitude in the time window (gray stripe) was reduced. Numbers below the traceindicate baseline potential (in millivolts) before the stimulus in the depolarized (bold) and hyperpolarized condition. The recording electrode contained QX-314. B,l-AP-4 depolarized an OFF cell and increased its spike rate. l-AP-4 caused an increase in membrane variance, even in the absence of spiking (QX-314 electrode). C, For the white noise response, the spike L filter and NL function change in the presence of l-AP-4 (standard electrode). In the presence ofl-AP-4, the spike L filter became faster and less biphasic; the NL function became more linear at low contrast (less rectified), because the baseline spike rate increases from 0 to 30 Hz. L filters are normalized to their peak response (and NL functions are scaled accordingly; see Materials and Methods). sp, Spikes.
Fig. 7.
Fig. 7.
Circuit models for ON and OFF pathways.Left, The ON cell depolarizing response arises from a combination of excitation (cone → ON bipolar → ON ganglion) and feedforward inhibition (cone → ON bipolar → ON amacrine → ON ganglion); the reversal potential would be in between the reversal potentials of the two conductances. The ON cell hyperpolarizing response arises from the withdrawal of the synaptic inputs; this requires that the basal rate of glutamate release from the ON bipolar cell is high at rest. As evidence for this, ON cell depolarizing and hyperpolarizing light responses had a similar reversal potential, suggesting modulation up or down of a single conductance (Figs. 4, 5).Right, The OFF cell depolarizing response arises from a pathway that is parallel to the ON cell (i.e., a combination of excitation and feedforward inhibition). However, basal release of transmitter is apparently low at rest, so a strong hyperpolarizing response cannot be generated by the withdrawal of basal glutamate release. Instead, an additional input, involving cross talk from the ON pathway, is required (cone → ON bipolar → ON amacrine → OFF ganglion). As evidence for this inhibitory pathway, the OFF cell hyperpolarizing light response arose from direct inhibition (Fig. 4) and was blocked by l-AP-4 (Fig. 6). l-AP-4 also caused an OFF cell to depolarize in a tonic manner (Fig.6B), suggesting that the ON amacrine cell provides tonic inhibition at mean luminance.

Similar articles

Cited by

References

    1. Ashmore JF, Copenhagen DR. An analysis of transmission from cones to hyperpolarizing bipolar cells in the retina of the turtle. J Physiol (Lond) 1983;340:569–597. - PMC - PubMed
    1. Awatramani GB, Slaughter MM. Intensity-dependent, rapid activation of presynaptic metabotropic glutamate receptors at a central synapse. J Neurosci. 2001;21:741–749. - PMC - PubMed
    1. Baccus SA, Meister M. Fast and slow contrast adaptation in retinal circuitry. Neuron. 2002;36:909–919. - PubMed
    1. Belgum JH, Dvorak DR, McReynolds JS. Sustained synaptic input to ganglion cells of mudpuppy retina. J Physiol (Lond) 1982;326:91–108. - PMC - PubMed
    1. Benardete EA, Kaplan E. The dynamics of primate M retinal ganglion cells. Vis Neurosci. 1999;16:355–368. - PubMed

Publication types