. 2003 Apr 1;23(7):2840-50.
doi: 10.1523/JNEUROSCI.23-07-02840.2003.

Dopamine modulates cell cycle in the lateral ganglionic eminence

Affiliations

Dopamine modulates cell cycle in the lateral ganglionic eminence

Nobuyo Ohtani et al. J Neurosci. .

Abstract

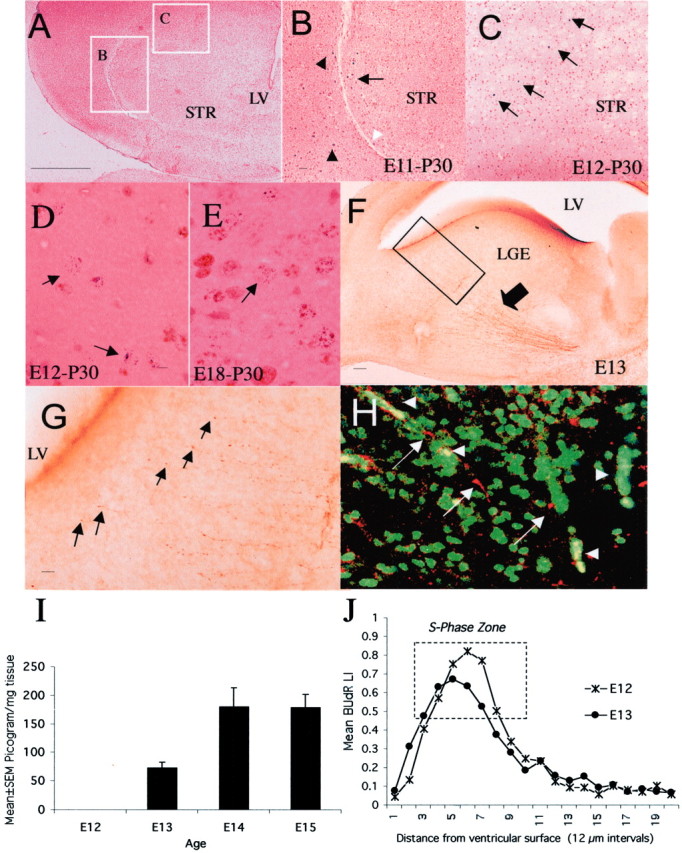
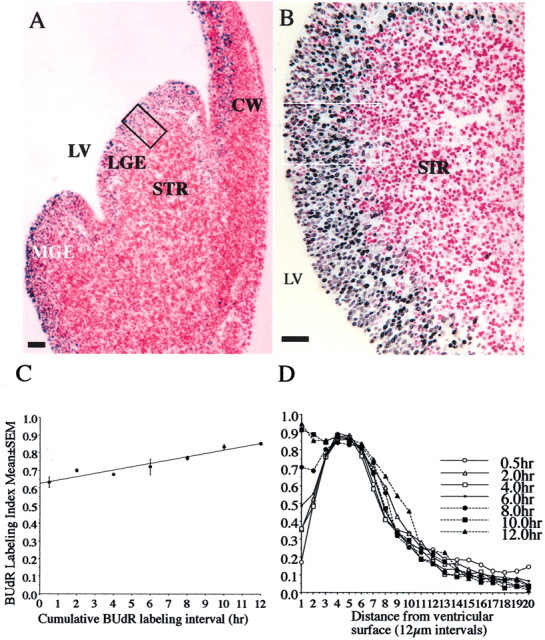
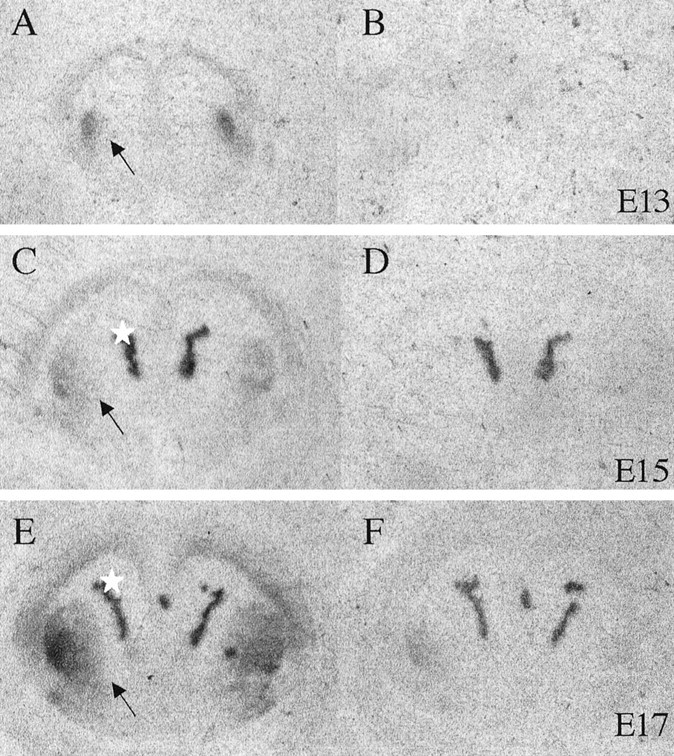
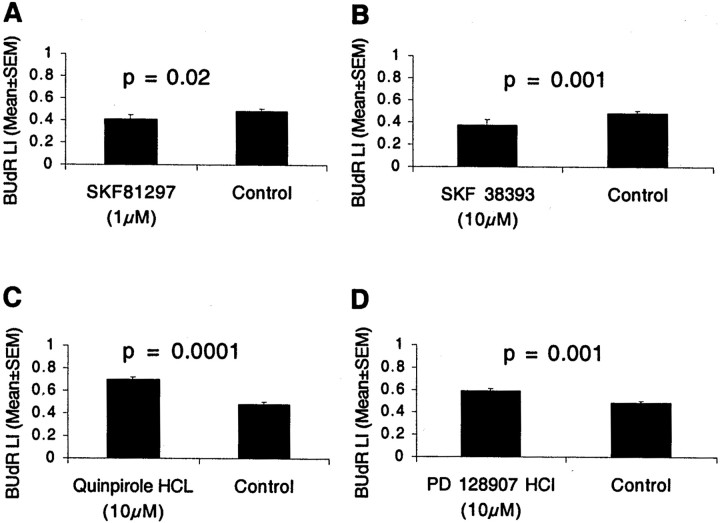
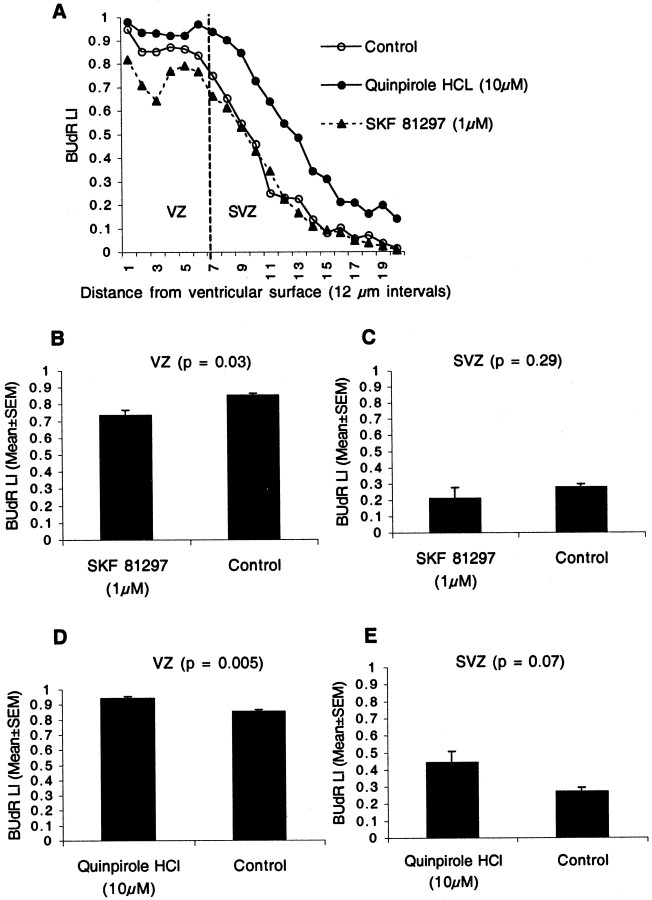
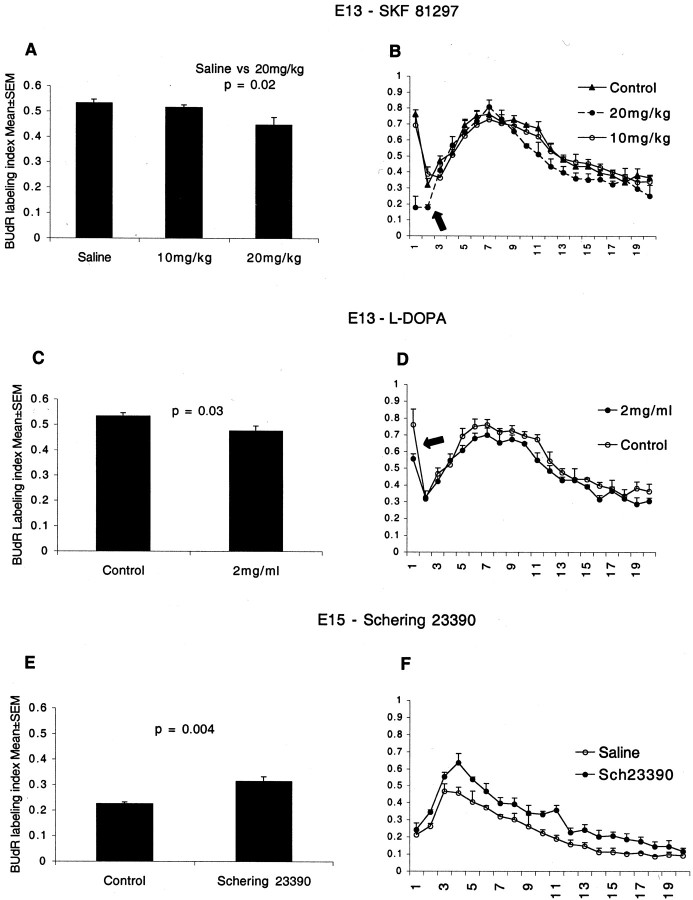
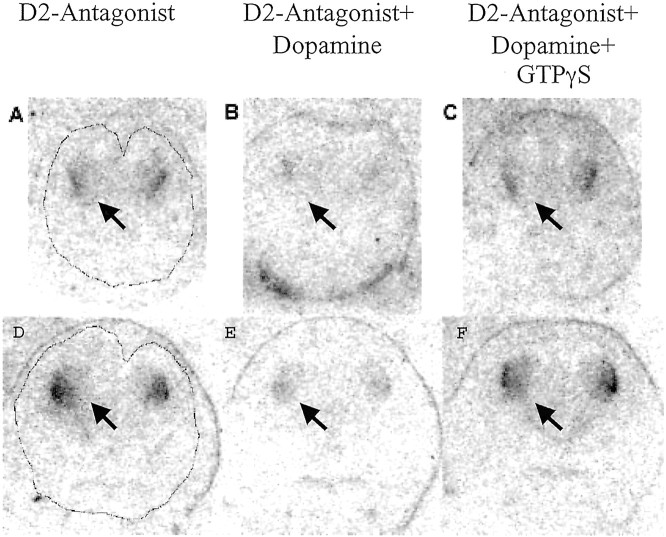
Dopamine is a neuromodulator the functions of which in the regulation of complex behaviors such as mood, motivation, and attention are well known. Dopamine appears in the brain early in the embryonic period when none of those behaviors is robust, raising the possibility that dopamine may influence brain development. The effects of dopamine on specific developmental processes such as neurogenesis are not fully characterized. The neostriatum is a dopamine-rich region of the developing and mature brain. If dopamine influenced neurogenesis, the effects would likely be pronounced in the neostriatum. Therefore, we examined whether dopamine influenced neostriatal neurogenesis by influencing the cell cycle of progenitor cells in the lateral ganglionic eminence (LGE), the neuroepithelial precursor of the neostriatum. We show that dopamine arrives in the LGE via the nigrostriatal pathway early in the embryonic period and that neostriatal neurogenesis progresses in a dopamine-rich milieu. Dopamine D1-like receptor activation reduces entry of progenitor cells from the G(1)- to S-phase of the cell cycle, whereas D2-like receptor activation produces the opposite effects by promoting G(1)- to S-phase entry. D1-like effects are prominent in the ventricular zone, and D2-like effects are prominent in the subventricular zone. The overall effects of dopamine on the cell cycle are D1-like effects, most likely because of the preponderance of D1-like binding sites in the embryonic neostriatum. These data reveal a novel developmental role for dopamine and underscore the relevance of dopaminergic signaling in brain development.


Figures

Fig. 1.
Fig. 1.
Neurogenesis in the LGE occurs in a dopamine-rich milieu. When E11 mice were exposed to BUdR, labeled cells were found at the lateral margin of the neostriatum (B,arrow) just medial to the external capsule (B, white arrowhead) as well as outside the neostriatal borders on P30 (B, black arrowheads, E11-P30). When E12 mice were exposed to BUdR, labeled cells were found throughout the neostriatum (C, arrows) as well as outside the neostriatum on P30 (E12-P30). The position of labeled cells shown in B and C is indicated bywhite rectangles in A. When a double S-phase labeling method was used, cells labeled with3H-TdR-only were present in the neostriatum on P30 if the S-phase marker injections were administered on E12 (D,arrows, E12-P30) or E18 (E, arrow, E18-P30) but not on E11, confirming that neostriatal neurogenesis began on E12.F, TH-positive axons in the neostriatum (arrow) on E13. The boxed area inF is shown at a higher magnification in Gto illustrate growing tips of TH-positive fibers (G,arrows) within 25–50 μm of the lateral ventricular border. TH-positive axons and growth cones (white arrows) are in close proximity to BUdR-labeled (green) nuclei in the LGE (H). Red blood cells that fluoresce in both the green and red filters appear yellowish orange(H, white arrowheads). Dopamine content of the forebrain was undetectable on E12 and rose dramatically between E12 and E13 (I) coincident with the arrival of TH-positive axons in the LGE (F). BUdR LI decreased between E12 and E13 in the S-phase zone of the LGE (J), coincident with the arrival of dopamine. LV, Lateral ventricle; STR, neostriatum. Scale bars:A, 250 μm; (in B) B,C, 50 μm; (in D) D,E, 5 μm; F, 50 μm; G, 10 μm; H, 20 μm.
Fig. 2.
Fig. 2.
Photomicrographs of a 4-μm-thick, paraffin wax-embedded section through an E13 explant that was cultured for 12 hr with continuous exposure to BUdR (A). The section was processed for BUdR immunohistochemistry and stained with basic fuchsin. BUdR-labeled and non-BUdR-labeled (i.e., basic fuchsin-only labeled) cells are shown at higher magnification in B. BUdR LI (BUdR-labeled cells divided by all cells) was calculated within a 120 × 240 μm wide sector of the LGE (A,B, boxed region). The sector was subdivided into 20 bins (12 × 120 μm) using a microscope ocular grid. Initially, the BUdR LI was calculated for the VZ (corresponding to bins 1–7) and plotted against labeling interval (C). VZ consists predominantly of progenitor cells (and only very few postmitotic cells), fulfilling the criteria for a cell population the cell cycle kinetics of which can be analyzed by cumulative S-phase labeling methods (Nowakowski et al., 1989). The BUdR LI increased linearly in the VZ from 0.5 to 12 hr (C), suggesting that the progenitor cells entered S-phase successfully clearing G1- to S-phase transition. When the BUdR LI was calculated for each of the 20 bins for each labeling interval (0.5 to 12 hr) and plotted against distance from the ventricular surface, the LI profiles changed in step with the interkinetic nuclear migration of the progenitor cells (D). The BUdR LI in bin 1 increased progressively, showing that BUdR-labeled cells left the S-phase and arrived at the ventricular surface for mitosis. Thus, G2- to M-phase transition occurred successfully in the explants.LV, Lateral ventricle; LGE, lateral ganglionic eminence; MGE, medial ganglionic eminence;STR, neostriatum; CW, cerebral wall. Scale bars: A, 150 μm; B, 75 μm.
Fig. 3.
Fig. 3.
Dopamine D1 receptor binding in the neostriatum of E13 (A, B), E15 (C, D), and E17 (E, F) mice. Sections were incubated with tritiated D1 antagonist Schering 23390 (1 nm;A, C, E) or dopamine (10 μm) plus the antagonist to reveal nonspecific or total binding (B, D, F) and exposed to autoradiographic film. Binding is pronounced in the neostriatum (arrows), and nonspecific binding is seen in the choroid plexus (asterisks). The nonspecific binding was seen also in dopamine-exposed sections (D, F) and was accounted for when calculating the binding intensities shown in Table 1.
Fig. 4.
Fig. 4.
Two dopamine D1-like receptor agonists SKF 81297 (A) and SKF 38393 (B) reduced the BUdR LI in LGE explants from E13 mice. Two D2-like agonists, quinpirole and PD 128907, produced the opposite effects: they increased the BUdR LI (C, D). The explants were cultured with the agonists or without any drug (Control) for 12 hr with continuous exposure to BUdR. The BUdR LI was calculated for the entire LGE spanning 20 bins, to include the VZ as well as the SVZ. The BUdR LI in Figure 2C is for the VZ only (i.e., for bins 1–7) and is higher than the values here because the SVZ region (included in the analysis here) also contains nonproliferating (postmitotic) cells that do not become BUdR labeled. The incidence of cell death was <0.1% under all conditions. Four to six explants were analyzed in each experiment group. The mean and SEM values are based on the five replications.
Fig. 5.
Fig. 5.
Effects of D1-like and D2-like agonists on BUdR LI were examined separately for the VZ and the SVZ in the E13 LGE. The BUdR LI was plotted as a function of distance from the ventricular surface by calculating the LI for each of 20 bins (A). The border between the VZ and the SVZ was set at bin 7 (A). The D1-like agonist SKF 81297 reduced the LI in the VZ (B) but did not produce significant effects in the SVZ (B). The D2-like agonist quinpirole increased the LI in both the VZ (D) and the SVZ (E), with a larger increase in the latter.
Fig. 6.
Fig. 6.
The effects of D1-like receptor agonist SKF 81297 (A, B) and l-DOPA (C, D) on BUdR LI in the LGE of E13 mice in vivo and the effects of blocking the D1-like receptors on BUdR LI in the LGE of E15 micein vivo (E, F). BUdR exposure was for 2 hr, and the LI was calculated for the entire LGE sector (A, C, E) as well as for each of 20 bins to analyze interkinetic nuclear migration (B, D, F). SKF 81297 was injected intraperitoneally into pregnant mice in two doses to produce a 6 hr exposure of the E13 embryos to the drug. Control groups received saline injections. BUdR was administered to the mother 2 hr before it was killed. SKF 81297 reduced the BUdR LI in the LGE at 20 mg/kg but had no effect at 10 mg/kg (A). The dopamine precursor, l-DOPA, and the antioxidant ascorbic acid were administered to pregnant mice in drinking water from E10 to E13. Control groups received ascorbic acid only. BUdR was administered to the mothers 2 hr before they were killed. l-DOPA also reduced the BUdR LI in the LGE (C). Thus, as in the explants, D1-agonist and dopamine reduced the BUdR LI. The D1-like receptor antagonist Schering 23390 was injected into the forebrain ventricles of E15 mice in utero. Two hours later, BUdR was administered to the mother carrying the injected embryos. The mice were killed 2 hr after the BUdR administration. Schering 23390 increased the BUdR LI (E). The increase in the LI indicates that augmenting D2-like receptor activation by endogenous dopamine as a result of blocking the endogenous D1-like receptors promoted G1- to S-phase entry. The BUdR LI is lower at E15 (E) than at E13 (A, C) because of the normal developmental decline in cell proliferation. The distribution of BUdR LI in the 20 bins in the drug-administered groups was similar to that in the control groups in all three experiments (Fig.6B,D,F). Therefore, the interkinetic nuclear migration was preserved after the drug administration, indicating that there was no gross perturbation of cell cycle progression. The marked rise in the LI in bin 1 in the E13 plots (B, D, arrows) is not evident in the E15 plots (F). The size of the SVZ increases significantly from E13 to E15. The SVZ progenitors do not migrate to the ventricular border (bin 1) for M-phase. Therefore, there is a lower increase in the BUdR LI in that region on E15 compared with E13.
Fig. 7.
Fig. 7.
D2 receptor coupling to G-proteins in sections of E15 (A–C) and E16 (D–F) mouse brains. Shown are autoradiograms of consecutive 12-μm-thick coronal sections through the entire heads of E15 (A–C) and E16 (D–F) mice incubated with [125I]iodosulpiride (D2-Antagonist) alone (A,D), [125I]iodosulpiride plus 2 μm dopamine (B, E), or [125I]iodosulpiride plus 2 μmdopamine plus 10 μm GTPγS (C,F). Outlines of the brain are shown inA and D. The labeling is evident at this coronal plane only in the neostriatum (arrows).

Similar articles

Cited by

References

    1. Akbarian S, Kim JJ, Potkin SG, Hagman JO, Tafazzoli A, Bunney WE, Jr, Jones EG. Gene expression for glutamic acid decarboxylase is reduced without loss of neurons in prefrontal cortex of schizophrenics. Arch Gen Psychiatry. 1995;52:258–266. - PubMed
    1. Anderson SA, Eisenstat DD, Shi L, Rubenstein JLR. Interneuron migration from basal forebrain to neocortex: dependence on Dlx genes. Science. 1997;278:474–476. - PubMed
    1. Benes FM. Emerging principles of altered neural circuitry in schizophrenia. Brain Res Brain Res Rev. 2000;31:251–269. - PubMed
    1. Benes FM, Vincent SL, Marie A, Kahn Y. Up-regulation of GABA receptor binding on neurons of the prefrontal cortex in schizophrenic subjects. Neuroscience. 1996;75:1021–1031. - PubMed
    1. Bhide PG. Cell cycle kinetics in the embryonic mouse corpus striatum. J Comp Neurol. 1996;374:506–522. - PubMed

Publication types

LinkOut - more resources