Comparative Study
. 2003 Apr 1;23(7):3066-75.
doi: 10.1523/JNEUROSCI.23-07-03066.2003.

System identification applied to a visuomotor task: near-optimal human performance in a noisy changing task

Affiliations
Comparative Study

System identification applied to a visuomotor task: near-optimal human performance in a noisy changing task

R J Baddeley et al. J Neurosci. .

Abstract

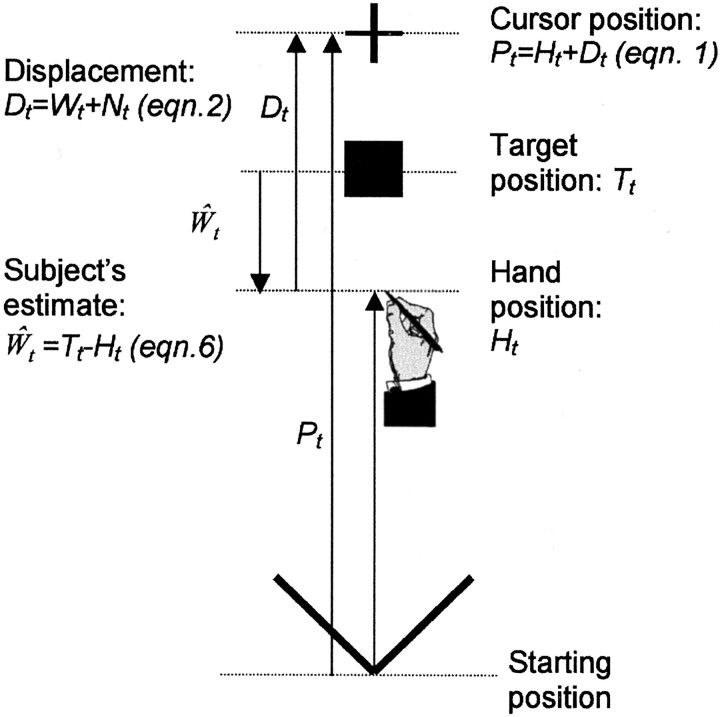
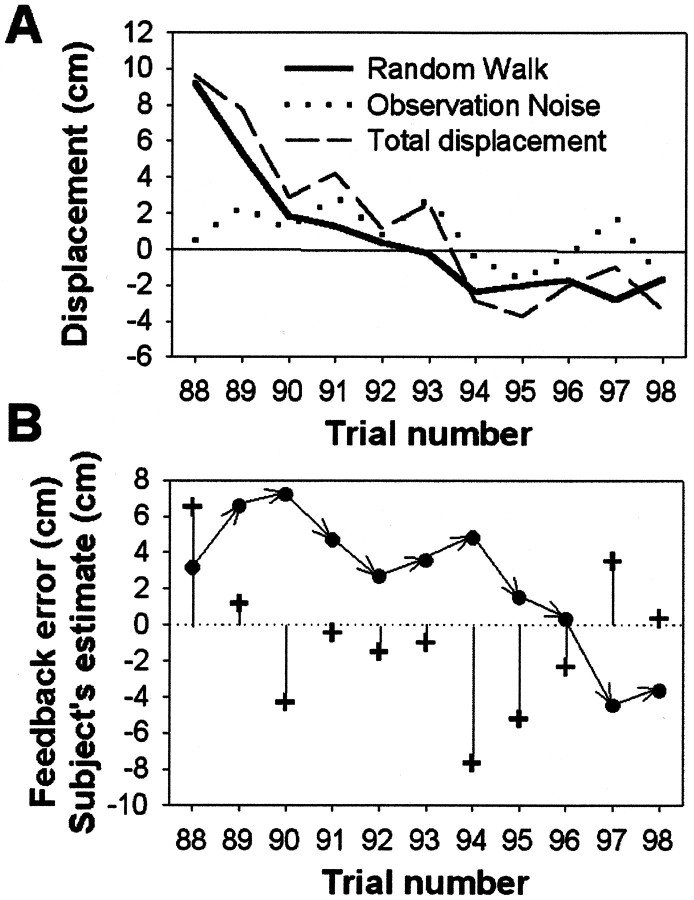
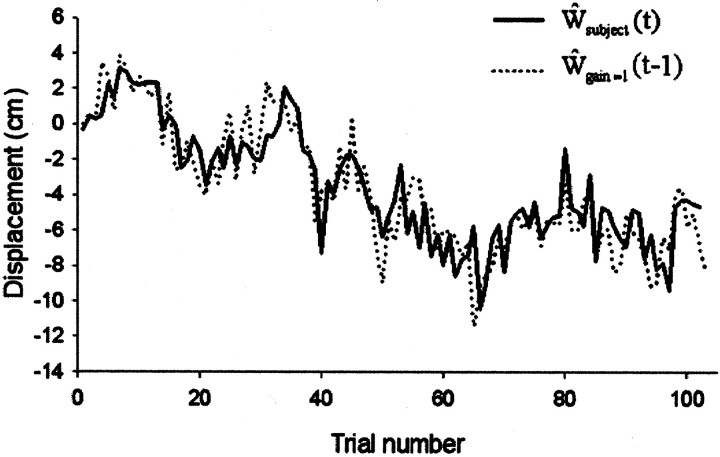
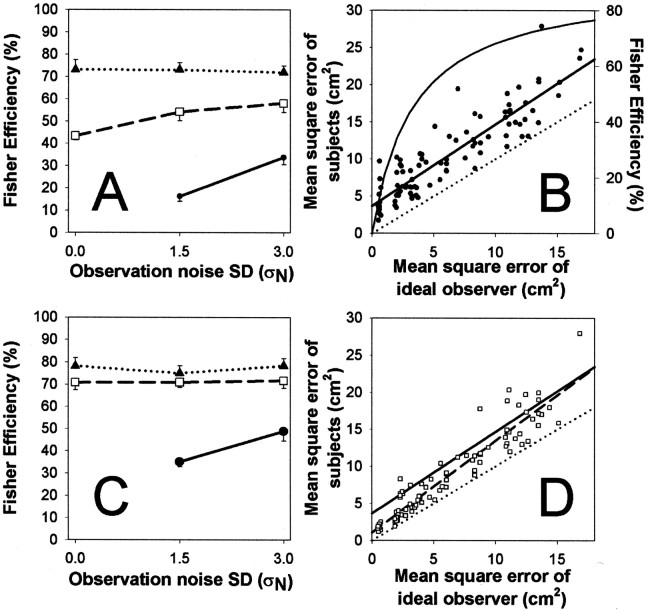
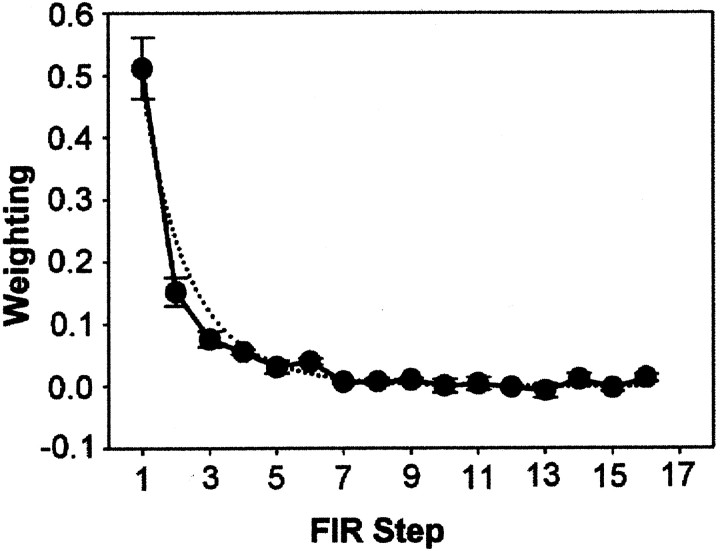
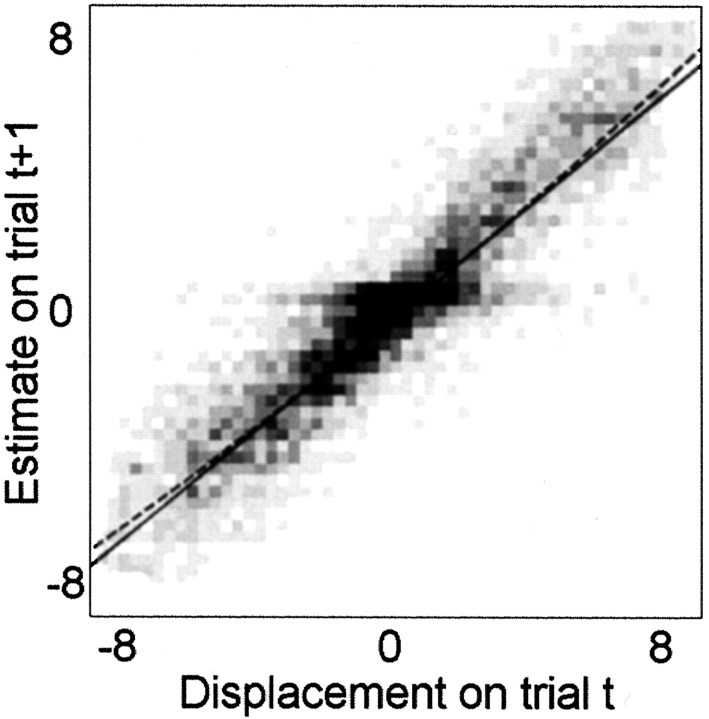
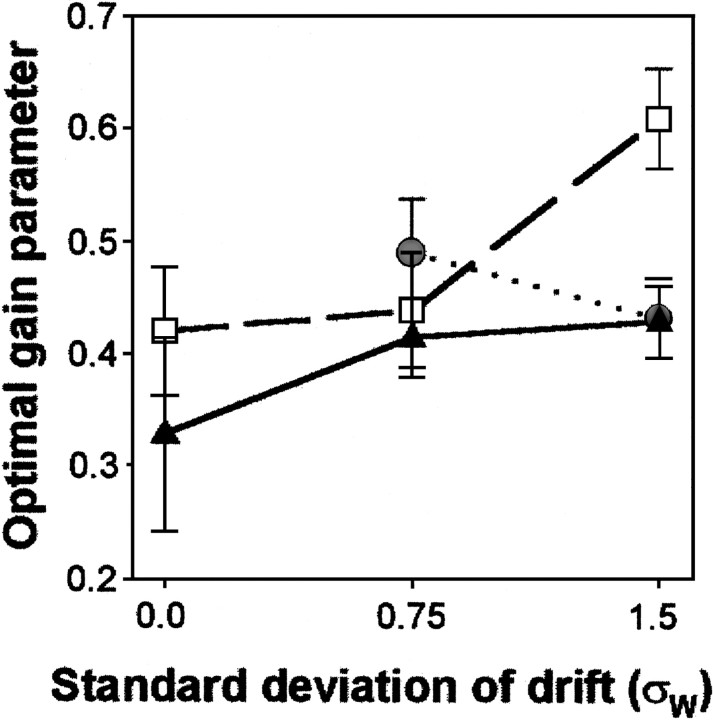
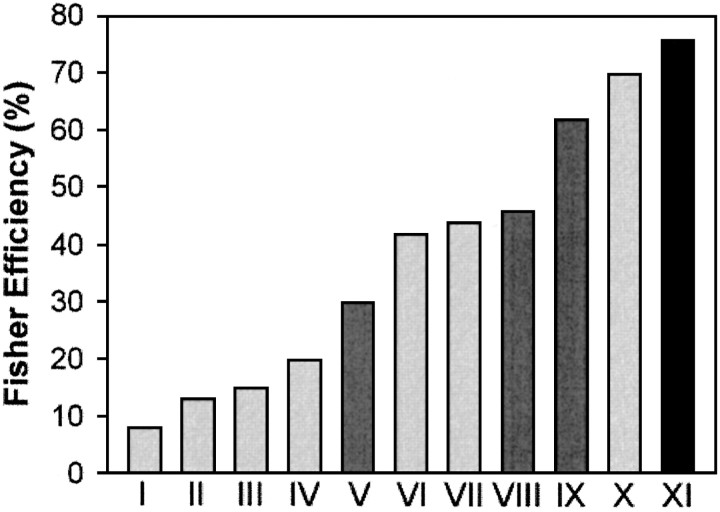
Sensory-motor integration has frequently been studied using a single-step change in a control variable such as prismatic lens angle and has revealed human visuomotor adaptation to often be partial and inefficient. We propose that the changes occurring in everyday life are better represented as the accumulation of many smaller perturbations contaminated by measurement noise. We have therefore tested human performance to random walk variations in the visual feedback of hand movements during a pointing task. Subjects made discrete targeted pointing movements to a visual target and received terminal feedback via a cursor the position of which was offset from the actual movement endpoint by a random walk element and a random observation element. By applying ideal observer analysis, which for this task compares human performance against that of a Kalman filter, we show that the subjects' performance was highly efficient with Fisher efficiencies reaching 73%. We then used system identification techniques to characterize the control strategy used. A "modified" delta-rule algorithm best modeled the human data, which suggests that they estimated the random walk perturbation of feedback in this task using an exponential weighting of recent errors. The time constant of the exponential weighting of the best-fitting model varied with the rate of random walk drift. Because human efficiency levels were high and did not vary greatly across three levels of observation noise, these results suggest that the algorithm the subjects used exponentially weighted recent errors with a weighting that varied with the level of drift in the task to maintain efficient performance.


Figures

Fig. 1.
Fig. 1.
The visuomotor task. A target (■) was presented at position Tt, and the aim of the subject was to make a movement to bring a cursor (+) to land at this location. The cursor position (Pt) was displaced from the hand movement (Ht) by an amount determined by a random walk (Wt), plus a random noise component (Nt). Therefore for the subject to perform optimally, the size of the random walk component would need to be estimated (Ŵt) and taken into account when making the movement (subject's optimal movement would be Ht = Tt −Ŵt; Eq. 6).
Fig. 2.
Fig. 2.
Typical displacement data and one subject's estimation of the displacement. A, Typical random walk values Wt over 11 trials are indicated by thebold solid line. Observation noise Nt(dotted line) was then added to Wt to give the total added displacement Dt(dashed line). Note how Wt is correlated with Wt−1, whereas Nt is uncorrelated from trial to trial.B, The same set of trials as in A showing the feedback error, Pt − Tt (+) and the subject's estimate of the displacement or Tt − Mt, (●) for each trial. Note how the subject adjusts her estimate of the displacement over succeeding trials in response to the feedback error. These data are from one of the high-drift, medium-noise sessions (ςN = 1.5 cm; ςW= 1.5 cm).
Fig. 3.
Fig. 3.
Typical data from a complete run of 102 trials in the high-drift, medium-noise condition (ςN = 1.5 cm; ςW = 1.5 cm). Here the subject's estimate (dotted lines) is shown against the actual displacement data (solid line). To emphasize the relationship between subject response and previous error, the displacement data curve has been displaced to the right by one trial. It therefore represents the performance of a system (Model 1) that estimates the displacement on trial t from the error observed on trial t − 1.
Fig. 4.
Fig. 4.
A, Subjects were very efficient (maximum 73%) at adapting to a random walk (with SD ςW). Data are plotted as Fisher efficiencies (the ratio of the mean square error of the ideal observer to the mean square error of the subject) across all conditions (●: no drift ςW = 0 cm; □: medium ςW = 0.75 cm; ▴: high drift ςW = 1.5 cm; mean efficiency ±1 SE; n = 12). B, Subjects' run-by-run performance versus ideal performance. Subjects' mean square error is plotted against the corresponding mean square error of the ideal observer (●, n = 96: 4 subjects × 8 conditions × 3 repetitions); the bold line is the regression. Thedotted line shows the performance of the ideal observer (i.e., slope equals 1 and intercept zero). The curve is an estimate of subjects' efficiency against the mean square errors of the ideal observer (Eq. 18), plotted against the axis on the right.The level of mean square error expected if subjects failed to track the drift component for ςW = 0.75 or 1.5 would be 19.7 and 78.9 cm2, respectively, in the absence of observation noise (ςN = 0). The mean squared displacement caused only by observation noise (ςW = 0) would be 2.0 and 8.2 cm2, for ςN = 1.5 and 3 cm, respectively. C, Fisher efficiency scores for subjects' performance when direct vision of the hand was allowed. The graph is in the same format as in Figure 4A. D, Run-by-run performance versus the ideal, with data from sessions with direct vision of the hand (□, n = 96), the regression of this data is shown by the bold dashed line. For comparison, the regression line from Figure 4B is also shown (no-vision, solid bold line).
Fig. 5.
Fig. 5.
The average coefficients for the best 16-point finite impulse response filter fitted to each subject's data (solid line, with 1 SEM). The fine line shows the average exponential weighting found by the delta rule fits (Model 2).FIR Step, Finite impulse response coefficient number (Eq.9).
Fig. 6.
Fig. 6.
A density plot of the applied displacement Dt−1 plotted against the subjects' estimate of drift Ŵt. A linear regression and polynomial regression line are superimposed: for the latter, all terms higher than linear were nonsignificant.
Fig. 7.
Fig. 7.
A plot of the learning rate parameter K (mean n = 5; ±1 SD) for the best fitting modified delta rule models, calculated condition by condition for each subject. The best learning rate varied across the three levels of random walk variance tested; in comparison, the human efficiency measures were stable across observation noise levels (Fig. 4A, C).
Fig. 8.
Fig. 8.
The highest reported human efficiencies in a number of tasks. Vision tasks are presented in light gray, auditory tasks in dark gray, and the single motor study (present results) in black. I, Recognizing three-dimensional (3D) objects in luminance noise (Tjan et al., 1995);II, 3D object classification (Liu et al., 1995); III, global direction of dynamic random dots (Watamaniuk, 1993); IV, heading judgements (Crowell and Banks, 1996); V, detection of complex signals as a function of signal bandwidth and duration (Creelman, 1961); VI, letter discrimination (Parish and Sperling, 1991); VII, coherent visual motion (Barlow and Tripathy, 1997);VIII, discrimination of random, time-varying auditory spectra (Lufti, 1994); IX, discrimination of tonal frequency distributions (Berg, 1990);X, discrimination of the amplitude of a spatial sinusoid (Burgess et al., 1981); XI, data from the present study. The efficiency reported in the present study is higher than those reported previously.

Similar articles

Cited by

References

    1. Akaike H. A new look at the statistical model identication. IEEE Trans AC. 1974;19:716–723.
    1. Baddeley RJ, Tripathy S. Insights into motion perception by observer modelling. J Opt Soc Am [A] 1998;15:289–296. - PubMed
    1. Barlow HB, Tripathy SP. Correspondence noise and signal pooling in the detection of coherent visual motion. J Neurosci. 1997;17:7954–7966. - PMC - PubMed
    1. Berg BG. Observer efficiency and weights in a multiple observation task. J Acoust Soc Am. 1990;88:149–158. - PubMed
    1. Borah J, Young LR, Curry RE. Optimal estimator model for human spatial orientation. Ann NY Acad Sci. 1988;545:51–73. - PubMed

Publication types

LinkOut - more resources