. 2003 Jun 1;549(Pt 2):471-88.
doi: 10.1113/jphysiol.2002.037614. Epub 2003 Apr 11.

Synaptically activated Ca2+ waves in layer 2/3 and layer 5 rat neocortical pyramidal neurons

Affiliations

Synaptically activated Ca2+ waves in layer 2/3 and layer 5 rat neocortical pyramidal neurons

Matthew E Larkum et al. J Physiol. .

Abstract

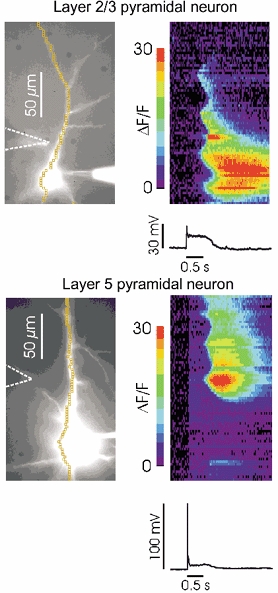
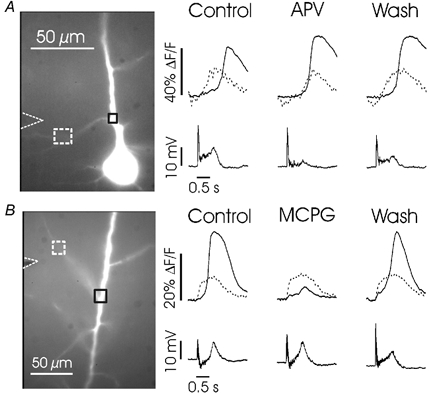
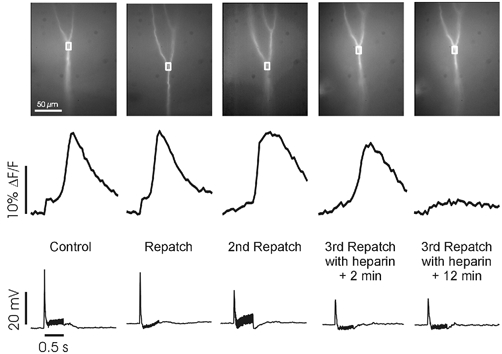
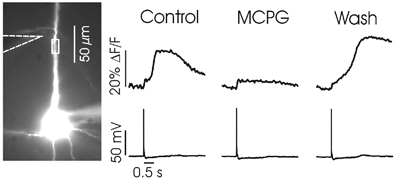
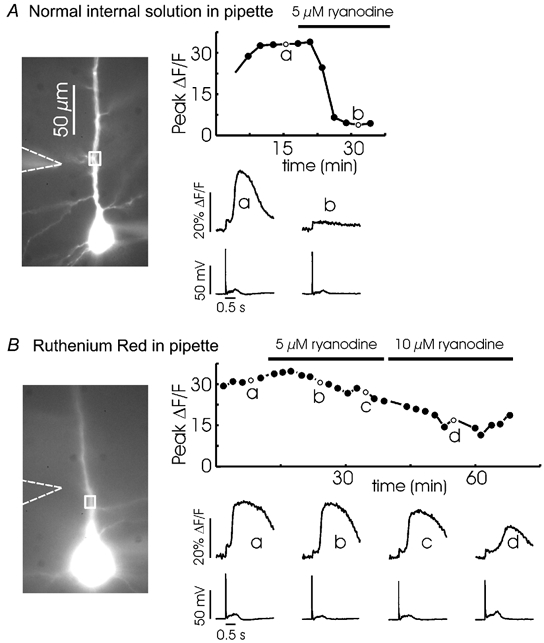
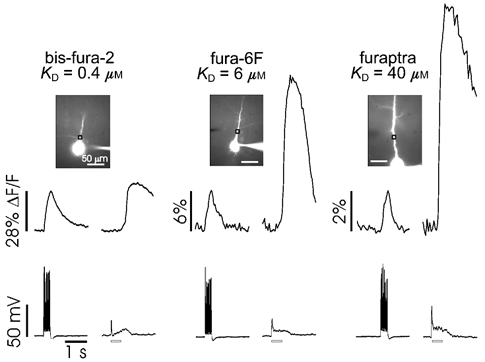
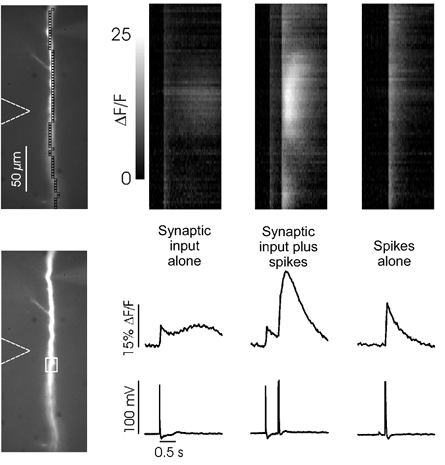
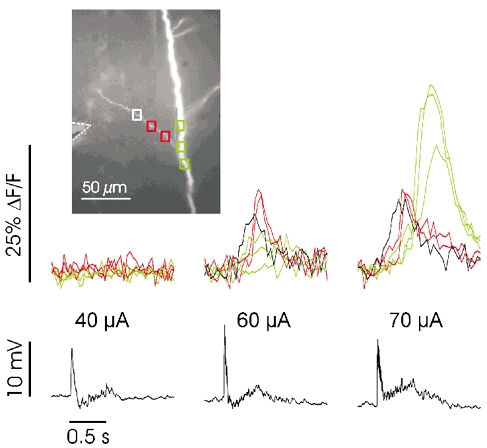
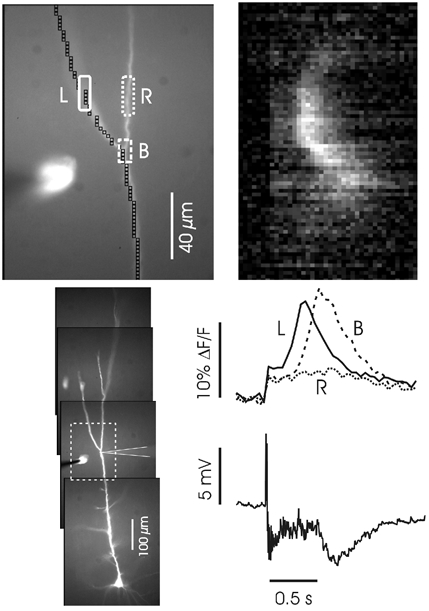
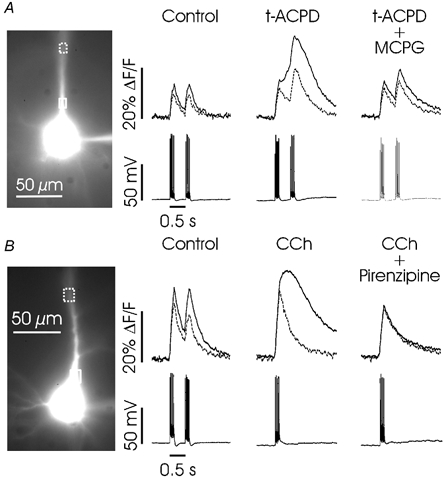
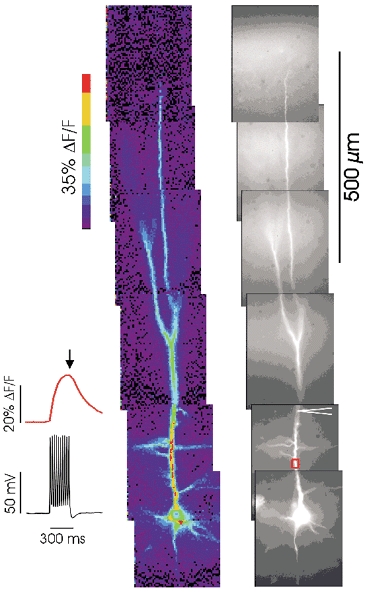
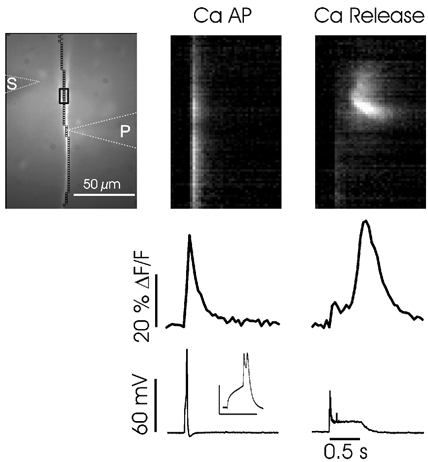
Calcium waves in layer 2/3 and layer 5 neocortical somatosensory pyramidal neurons were examined in slices from 2- to 8-week-old rats. Repetitive synaptic stimulation evoked a delayed, all-or-none [Ca2+]i increase primarily on the main dendritic shaft. This component was blocked by 1 mM (R,S)-alpha-methyl-4-carboxyphenylglycine (MCPG), 10 microM ryanodine, 1 mg ml-1 internal heparin, and was not blocked by 400 microM internal Ruthenium Red, indicating that it was due to Ca2+ release from internal stores by inositol 1,4,5-trisphosphate (IP3) mobilized via activation of metabotropic glutamate receptors. Calcium waves were initiated on the apical shaft at sites between the soma to around the main branch point, mostly at insertion points of oblique dendrites, and spread in both directions along the shaft. In the proximal dendrites the peak amplitude of the resulting [Ca2+]i change was much larger than that evoked by a train of Na+ spikes. In distal dendrites the peak amplitude was comparable to the [Ca2+]i change due to a Ca2+ spike. IP3-mediated Ca2+ release also was observed in the presence of the metabotropic agonists t-ACPD and carbachol when backpropagating spikes were generated. Ca2+ entry through NMDA receptors was observed primarily on the oblique dendrites. The main differences between waves in neocortical neurons and in previously described hippocampal pyramidal neurons were, (a) Ca2+ waves in L5 neurons could be evoked further out along the main shaft, (b) Ca2+ waves extended slightly further out into the oblique dendrites and (c) higher concentrations of bath-applied t-ACPD and carbachol were required to generate Ca2+ release events by backpropagating action potentials.


Figures

Figure 1
Figure 1. Repetitive synaptic stimulation evokes Ca2+ waves in layer 2/3 and layer 5 neocortical pyramidal neurons
Left, the images show bis-fura-2 filled neurons. Patch electrodes are visible on the somata; the stimulating electrode is indicated in both images by dashed lines. Right, fluorescence changes at different locations in the cells in response to 100 Hz stimulation for 0.5 s. The abscissa of the pseudocolour images correspond to the time axis of the electrical traces below, recorded at the soma. The ordinate corresponds to the chain of ‘superpixels’ through the dendrites and somata. The ‘line scan’ images show that in each cell a large [Ca2+]i increase occurred in the dendrites and (in the L2/3 neuron) in the soma. These [Ca2+]i changes initiated at several locations after a delay of several hundred milliseconds from the start of synaptic stimulation. They propagated over a restricted region of the cell and had a duration of ∼0.5–1.5 s at different locations. In the layer 5 neuron the response generated an action potential at the beginning of the train. This spike evoked a smaller [Ca2+]i change that occurred almost simultaneously at all locations.
Figure 9
Figure 9. APV and MCPG differently affect the spatial distribution of dendritic [Ca2+]i increases
A, left (Control), responses in branch and shaft locations to 100 Hz (0.5 s) synaptic stimulation close to the branch. The [Ca2+]i increase on the branch peaked earlier than the increase on the shaft. Middle (APV), 100 μm APV added to the bath blocked the early part of the branch signal without any significant effect on the shaft signal. Right (Wash), recovery on return to normal ACSF. B, similar experiment on another cell in response to 1 mm MCPG. This mGluR antagonist reversibly eliminated the large shaft [Ca2+]i increase without any significant effect on the branch signal near the stimulating electrode. The electrical traces show the somatically recorded membrane potential changes.
Figure 3
Figure 3. Intradendritic heparin blocks synaptically evoked Ca2+ release
The images show a region of a L5 neuron near the primary branch point (350 μm from the soma). The cell was patched four times about 50 μm below the branch; the electrode was slowly removed after each trial. In Control and first two repatches the electrodes contained the normal internal solution. Repetitive synaptic stimulation (100 Hz for 0.5 s) evoked a large, delayed [Ca2+]i increase, which did not diminish after repatching over the course of ∼1.5 h. In the 3rd repatch the internal solution contained 2 mg ml−1 low MW heparin. Immediately after establishing a whole-cell recording from the dendrite, but before much heparin diffused into the dendrite, Ca2+ release was observed again. 10 min later, the same stimulation did not evoke Ca2+ release.
Figure 2
Figure 2. MCPG reversibly blocks the generation of Ca2+ waves in the dendrites
The image on the left shows the bis-fura-2 filled L5 pyramidal neuron with the position of the stimulating electrode indicated with dashed lines. The region of interest used for the measurements of [Ca 2+]i (shown to the right of the image) is indicated by a small white box near the stimulating electrode. Simultaneous electrical recordings are shown under the fluorescence measurements. In Control, synaptic stimulation evoked a sharp [Ca2+]i increase at the time of the spike (seen as a small step change of ∼5 % ΔF/F) followed by a larger [Ca2+]i increase due to the Ca2+ release wave. In MCPG (after 1 mm was added to ACSF) the wave was blocked but the spike signal remained. After wash and return to normal ACSF, synaptic stimulation again evoked a Ca2+ wave, but with different temporal characteristics.
Figure 4
Figure 4. Ca2+ release comes from ryanodine-sensitive stores but ryanodine receptors do not mediate release
A, extracellular synaptic stimulation (100 Hz for 0.5 s) evoked regenerative Ca2+ release in the apical dendrites. This experiment was repeated several times at 2 min intervals. The peak fluorescence change in each trial is plotted in the graph. One trial, t = 15 min (a), is shown below. After 17 min, 5 μm ryanodine was added to the bath. In subsequent trials the same stimulation did not evoke release. One example, at 31 min, is shown in b. B, a similar experiment except 400 μm Ruthenium Red was included in the pipette. When 5 μm ryanodine and later 10 μm ryanodine was added to the bath Ca2+ release was still observed. The peak amplitude of release gradually declined during the experiment (a common observation) possibly due to depletion of stores.
Figure 5
Figure 5. The relative fluorescence change due to Ca2+ release is large compared with the change from voltage-gated Ca2+ entry when measured with low-affinity indicators
Layer 5 pyramidal neurons were filled with bis-fura-2, fura-6F, or furaptra (KDs indicated below the names). Each cell was first stimulated with a train of 10 backpropagating action potentials (evoked by 2 ms intrasomatic pulses every 30 ms), followed by synaptic stimulation (100 Hz for 0.5 s, indicated by the hollow horizontal bars under the electrical traces). The relative amplitudes of the fluorescence changes, measured at the indicated regions of interest, are shown in the top panels. To better compare the release transients using the different indicators the spike signals were normalized to the same amplitude. The electrical responses from recordings made at the soma are shown below. Note that the scales for the fluorescence changes are different for each indicator.
Figure 6
Figure 6. Backpropagating spikes enhance synaptically activated Ca2+ release
The image shows a region of the apical dendrite of a layer 5 neuron that was relatively devoid of oblique branches. The soma is just below the bottom of the image. Line scans of ΔF/F are shown in the top row and the fluorescence change in the ROI shown in the bottom image are shown in the middle row with the corresponding electrical recordings underneath them. Synaptic input alone (100 Hz for 0.5 s) evoked a spike at the beginning of the postsynaptic response. The [Ca2+]i signal from the spike was comparable with the weak release signal that followed. Synaptic input plus spikes (stimulation at same intensity plus two action potentials separated by 30 ms evoked by 2 ms pulses in the soma) generated a large Ca2+ release transient in the region opposite the stimulating electrode. Spikes alone (two action potentials separated by 30 ms) produced a sharper and smaller [Ca2+]i increase. The scale for the greyscale line scans (top row) is the same for all three panels.
Figure 7
Figure 7. Synaptically activated Ca2+ waves initiate near branch points on the main apical shaft and not directly opposite the position of the stimulating electrode
A, Ca2+ wave evoked by repetitive synaptic stimulation (100 Hz for 0.5 s). The dashed line connects the site of wave initiation with the corresponding position on the apical shaft. The initiation site is close to a branch point. The traces below the images show the electrical recording and the fluorescence change from the ROI. B, histogram showing the distribution of Ca2+ release events as a function of the separation between the initiation site and the closest branch point. Most waves start close to branch points. C, histogram showing the distribution of events as a function of the separation between the initiation site and the position of the tip of the stimulating electrode. The correlation is not as close as with branch points. Note that the scales for the abscissas in B and C are different.
Figure 8
Figure 8. Threshold synaptic stimulation sometimes evokes Ca2+ release in an oblique dendrite close to the main shaft
Stimulation at three intensities (100 Hz for 0.5 s). At 40 μA an electrical response was recorded in the soma but there was no [Ca2+]i increase on the branch or shaft near the stimulating electrode. At 60 μA there was a delayed regenerative response at the two locations close to the shaft (red boxes), but little or no response on the shaft (green boxes). The immediate response at the third position (white box, black trace) was probably due to ligand-gated Ca2+ entry since it was blocked by 50 μm APV (data not shown; see also Fig. 9A). At 70 μA a strong regenerative and more delayed response was observed on the shaft. Note that the electrical response was still below action potential threshold.
Figure 10
Figure 10. Distal synaptic stimulation evokes Ca2+ release in the distal dendrites
The cell was patched on the dendrites just below a branch about 400 μm from the soma; the stimulating electrode was placed in the same region. The image top left is from the section in dashed lines below. Synaptic stimulation (100 Hz for 0.5 s) evoked a wave in this region. The ‘line scan’ and ROI traces below show that the wave was initiated above the branch point and propagated downwards in the left branch into the shaft but not into the right branch.
Figure 11
Figure 11. Backpropagating action potentials evoke Ca2+ release in the presence of the metabotropic agonists t-ACPD and CCh
A, in control conditions (normal ACSF) trains of backpropagating spikes evoked sharp increases in [Ca2+]i in a L5 pyramidal neuron both adjacent to the soma and in the proximal apical dendrite (ROIs shown over image of cell). The dashed traces correspond to the dashed ROIs. In t-ACPD (50 μm) the same action potentials induced a larger, rounded [Ca2+]i increase in the proximal dendrite, but the increase in the distal location was still sharp. Addition of MCPG (1 mm) to this solution blocked the rounded increase. B, a similar experiment using 20 μm CCh in another L5 pyramidal neuron. The Ca2+ release transient was larger in the proximal location and was blocked by 0.5 μm pirenzipine.
Figure 12
Figure 12. Backpropagating action potentials evoke [Ca2+]i increases at all dendritic locations
The fluorescence image on the right shows a montage of pictures, taken with the × 20 lens, that together span the entire apical dendritic arbor. The dendrites were patched with an electrode containing 150 μm bis-fura-2. The traces on the left show that a train of action potentials (10 spikes at 30 ms intervals) evoked a [Ca2+]i increase at the indicated ROI in the proximal dendrites that began at the start of the train and declined immediately after the train (average of 10 trials). The pseudocolour image shows the fluorescence change at the end of the train (arrow). To make the montage the experiment was repeated as the cell was moved to different positions. The largest changes are in the proximal apical dendrites, but fluorescence increases were detected at all locations where fluorescence was detected, including the apical tuft and oblique branches. Data from a 19-day-old rat.
Figure 13
Figure 13. Synaptically activated Ca2+ release generates similarly large but broader and more localized [Ca2+]i increases than dendritic Ca2+ spikes generate
Intradendritic depolarization evoked a Ca2+ spike (middle panels). Synaptic stimulation (100 Hz for 0.5 s) evoked a fluorescence change of similar amplitude at the same location (right panels). The patch electrode contained bis-fura-2 (150 μm). The positions of the stimulating electrode (S) and patch electrode (P) are shown with dotted lines. The Ca2+ spike evoked a [Ca2+]i increase at all locations in the camera field while the Ca2+ wave occurred in a more restricted region of the dendrites. Dendritic region 300–400 μm from the soma. Inset over electrical trace shows the expanded Ca2+ spike. Scale for inset: 50 mV, 100 ms.

Comment in

Similar articles

Cited by

References

    1. Baimbridge KG, Miller JJ, Parkes CO. Calcium-binding protein distribution in the rat brain. Brain Res. 1982;239:519–525. - PubMed
    1. Berridge MJ. Neuronal calcium signaling. Neuron. 1998;21:13–26. - PubMed
    1. Bezprozvanny I, Watras J, Ehrlich BE. Bell-shaped calcium response curves of Ins(1, 4, 5)P3- and calcium-gated channels from endoplasmic reticulum of cerebellum. Nature. 1991;351:751–754. - PubMed
    1. Conn PJ, Pin JP. Pharmacology and function of metabotropic glutamate receptors. Annu Rev Pharmacol Toxicol. 1997;37:205–237. - PubMed
    1. Daw MI, Bortolotto ZA, Saulle E, Zaman S, Collingridge GL, Isaac JT. Phosphatidylinositol 3 kinase regulates synapse specificity of hippocampal long-term depression. Nature Neurosci. 2002;5:835–836. - PubMed

Publication types

MeSH terms

LinkOut - more resources