

Oxygen exchange profile in rat muscles of contrasting fibre types
- PMID: 12692174
- PMCID: PMC2342949
- DOI: 10.1113/jphysiol.2002.035915
Oxygen exchange profile in rat muscles of contrasting fibre types
Abstract
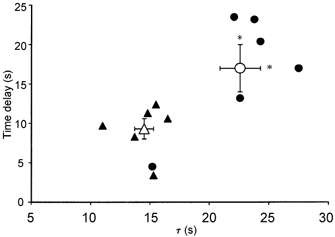
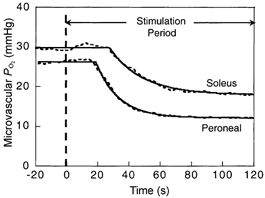
To determine whether fibre type affects the O2 exchange characteristics of skeletal muscle at the microcirculatory level we tested the hypothesis that, following the onset of contractions, muscle comprising predominately type I fibres (soleus, Sol, 86 % type I) would, based on demonstrated blood flow responses, exhibit a blunted microvascular PO2 (PO2,m, which is determined by the O2 delivery (QO2) to O2 uptake (VO2) ratio) profile (assessed via phosphorescence quenching) compared to muscle of primarily type II fibres (peroneal, Per, 84 % type II). PO2,m was measured at rest, and following the rest-contractions (twitch, 1 Hz, 2-4 V for 120 s) transition in Sol (n = 6) and Per (n = 6) muscles of Sprague-Dawley rats. Both muscles exhibited a delay followed by a mono-exponential decrease in PO2,m to the steady state. However, compared with Sol, Per demonstrated (1) a larger change in baseline minus steady state contracting PO2,m (DeltaPO2,m) (Per, 13.4 +/- 1.7 mmHg; Sol, 8.6 +/- 0.9 mmHg, P < 0.05); (2) a faster mean response time (i.e. time delay (TD) plus time constant (tau); Per, 23.8 +/- 1.5 s; Sol, 39.6 +/- 4.3 s, P < 0.05); and therefore (3) a greater rate of PO2,m decline (DeltaPO2,m/tau; Per, 0.92 +/- 0.08 mmHg s-1; Sol, 0.42 +/- 0.05 mmHg s-1, P < 0.05). These data demonstrate an increased microvascular pressure head of O2 at any given point after the initial time delay for Sol versus Per following the onset of contractions that is probably due to faster QO2 dynamics relative to those of VO2.
Figures
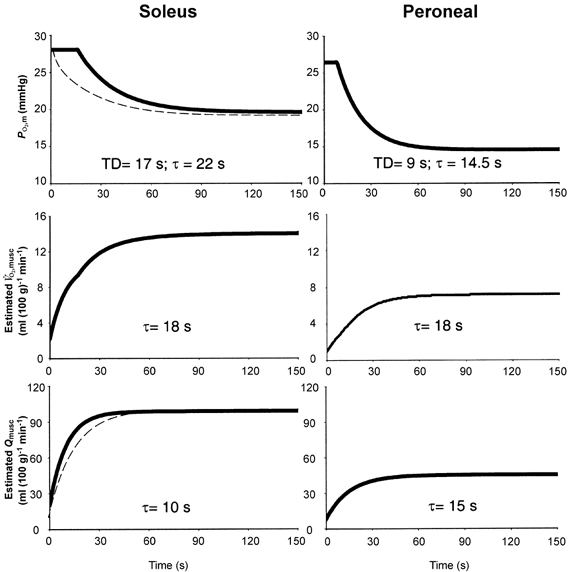
 ,musc responses (middle panels) and resultant
  response (bottom panels). Note substantially faster response in soleus required to produce the observed PO2,m profile. Dashed lines represent the theoretical effect of slowing the Sol response to match that of the Per (i.e. changing τ() from 10 to 15 s). The resultant PO2,m profile is substantially different from that actually observed.
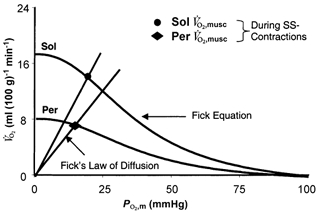 =
= (Ca,O2 - Cv,O2)), where represents blood flow and Ca,O2 and Cv,O2 represent arterial and venous O2 contents, respectively. Curvilinear lines drawn from oxyhaemoglobin dissociation curve (P50= 38.5 mmHg, ‘n’= 2.4; Altman & Dittmer, 1974). Fick's Law lines, =DO2,musc×PO2,m, where DO2,musc (diffusional coefficient) is the slope of the line from origin to calculated and PO2,m represents the microvascular O2 pressure within the capillary bed. Note the reduced (ordinate) and DO2,musc (slope of lines projecting from origin) in Per compared to Sol. SS-Contractions, steady state contracting values.
Similar articles
-
Effects of chronic heart failure in rats on the recovery of microvascular PO2 after contractions in muscles of opposing fibre type.Exp Physiol. 2004 Jul;89(4):473-85. doi: 10.1113/expphysiol.2004.027367. Epub 2004 May 6. Exp Physiol. 2004. PMID: 15131070
-
Transcapillary PO2 gradients in contracting muscles across the fibre type and oxidative continuum.J Physiol. 2020 Aug;598(15):3187-3202. doi: 10.1113/JP279608. Epub 2020 Jun 12. J Physiol. 2020. PMID: 32445225 Free PMC article.
-
Effects of chronic heart failure on microvascular oxygen exchange dynamics in muscles of contrasting fiber type.Cardiovasc Res. 2004 Feb 1;61(2):325-32. doi: 10.1016/j.cardiores.2003.11.020. Cardiovasc Res. 2004. PMID: 14736549
-
Skeletal muscle interstitial O2 pressures: bridging the gap between the capillary and myocyte.Microcirculation. 2019 Jul;26(5):e12497. doi: 10.1111/micc.12497. Epub 2018 Oct 10. Microcirculation. 2019. PMID: 30120845 Free PMC article. Review.
-
Dynamics of muscle microcirculatory oxygen exchange.Med Sci Sports Exerc. 2005 Sep;37(9):1559-66. doi: 10.1249/01.mss.0000177471.65789.ce. Med Sci Sports Exerc. 2005. PMID: 16177609 Review.
Cited by
-
Mechanical ventilation reduces rat diaphragm blood flow and impairs oxygen delivery and uptake.Crit Care Med. 2012 Oct;40(10):2858-66. doi: 10.1097/CCM.0b013e31825b933a. Crit Care Med. 2012. PMID: 22846782 Free PMC article.
-
Influence of nitric oxide synthase inhibition on pulmonary O2 uptake kinetics during supra-maximal exercise in humans.J Physiol. 2004 Dec 1;561(Pt 2):623-35. doi: 10.1113/jphysiol.2004.071894. Epub 2004 Sep 9. J Physiol. 2004. PMID: 15358808 Free PMC article.
-
Mouse soleus (slow) muscle shows greater intramyocellular lipid droplet accumulation than EDL (fast) muscle: fiber type-specific analysis.J Muscle Res Cell Motil. 2017 Apr;38(2):163-173. doi: 10.1007/s10974-017-9468-6. Epub 2017 Mar 9. J Muscle Res Cell Motil. 2017. PMID: 28281032
-
Dynamics of muscle microcirculatory and blood-myocyte O(2) flux during contractions.Acta Physiol (Oxf). 2011 Jul;202(3):293-310. doi: 10.1111/j.1748-1716.2010.02246.x. Epub 2011 Mar 1. Acta Physiol (Oxf). 2011. PMID: 21199399 Free PMC article. Review.
-
Sexual dimorphism in vascular ATP-sensitive K+ channel function supporting interstitial via convective and/or diffusive O2 transport.J Physiol. 2021 Jul;599(13):3279-3293. doi: 10.1113/JP281120. Epub 2021 Jun 8. J Physiol. 2021. PMID: 34101850 Free PMC article.
References
-
- Aaker A, Laughlin MH. Diaphragm arterioles are less responsive to alpha(1)-adrenergic constriction than gastrocnemius arterioles. J Appl Physiol. 2002;92:1808–1816. - PubMed
-
- Altman PL, Dittmer DS. The Biology Data Book. 2. III. Bethesda, MD: FASEB; 1974.
-
- Barstow TJ, Jones AM, Nguyen PH, Casaburi R. Influence of muscle fibre type and pedal frequency on oxygen uptake kinetics of heavy exercise. J Appl Physiol. 1996;81:1642–1650. - PubMed
-
- Barstow TJ, Molé PA. Simulation of pulmonary O2 uptake during exercise transients in humans. J Appl Physiol. 1987;63:2253–2261. - PubMed
Publication types
MeSH terms
Substances
Grants and funding
LinkOut - more resources
Full Text Sources