Cellulose synthesis is coupled to cell cycle progression at G1 in the dinoflagellate Crypthecodinium cohnii
- PMID: 12692327
- PMCID: PMC166924
- DOI: 10.1104/pp.102.018945
Cellulose synthesis is coupled to cell cycle progression at G1 in the dinoflagellate Crypthecodinium cohnii
Abstract
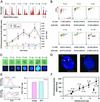
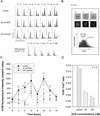
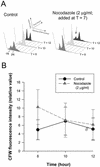
Cellulosic deposition in alveolar vesicles forms the "internal cell wall" in thecated dinoflagellates. The availability of synchronized single cells, the lack of secondary deposition, and the absence of cellulosic cell plates at division facilitate investigation of the possible roles of cellulose synthesis (CS) in the entire cell cycle. Flow cytograms of cellulosic contents revealed a stepwise process of CS in the dinoflagellate cell cycle, with the highest rate occurring at G(1). A cell cycle delay in G(1), but not G(2)/M, was observed after inhibition of CS. A cell cycle inhibitor of G(1)/S, but not G(2)/M, was able to delay cell cycle progression with a corresponding reduction of CS. The increase of cellulose content in the cell cycle corresponded well to the expected increase of surface area. No differences were observed in the cellulose to surface area ratio between normal and fast-growing G(1) cells, implicating the significance of surface area in linking CS to the coupling of cell growth with cell cycle progression. The coupling of CS to G(1) implicates a novel link between CS and cell cycle control, and we postulate that the coupling mechanism might integrate cell wall integrity to the cell size checkpoint.
Figures


Similar articles
-
Lipid biosynthesis and its coordination with cell cycle progression.Plant Cell Physiol. 2005 Dec;46(12):1973-86. doi: 10.1093/pcp/pci213. Epub 2005 Oct 20. Plant Cell Physiol. 2005. PMID: 16239308
-
Novel method for preparing spheroplasts from cells with an internal cellulosic cell wall.Eukaryot Cell. 2007 Mar;6(3):563-7. doi: 10.1128/EC.00301-06. Epub 2007 Jan 26. Eukaryot Cell. 2007. PMID: 17259549 Free PMC article.
-
The spindle checkpoint in the dinoflagellate Crypthecodinium cohnii.Exp Cell Res. 2000 Jan 10;254(1):120-9. doi: 10.1006/excr.1999.4749. Exp Cell Res. 2000. PMID: 10623472
-
Dinoflagellate Amphiesmal Dynamics: Cell Wall Deposition with Ecdysis and Cellular Growth.Mar Drugs. 2023 Jan 20;21(2):70. doi: 10.3390/md21020070. Mar Drugs. 2023. PMID: 36827111 Free PMC article. Review.
-
Proliferation of dinoflagellates: blooming or bleaching.Bioessays. 2005 Jul;27(7):730-40. doi: 10.1002/bies.20250. Bioessays. 2005. PMID: 15954095 Review.
Cited by
-
Dinochromosome Heterotermini with Telosomal Anchorages.Int J Mol Sci. 2024 Oct 21;25(20):11312. doi: 10.3390/ijms252011312. Int J Mol Sci. 2024. PMID: 39457094 Free PMC article.
-
Cell Cycle Synchronization of Primary and Cultured Articular Chondrocytes.Methods Mol Biol. 2022;2579:111-123. doi: 10.1007/978-1-0716-2736-5_9. Methods Mol Biol. 2022. PMID: 36045202
-
Cell Cycle Synchronization of Primary Articular Chondrocytes Enhances Chondrogenesis.Cartilage. 2021 Oct;12(4):526-535. doi: 10.1177/1947603519841677. Epub 2019 Apr 11. Cartilage. 2021. PMID: 30971093 Free PMC article.
-
Obtaining spheroplasts of armored dinoflagellates and first single-channel recordings of their ion channels using patch-clamping.Mar Drugs. 2014 Sep 5;12(9):4743-55. doi: 10.3390/md12094743. Mar Drugs. 2014. PMID: 25199048 Free PMC article.
-
Stressor-induced ecdysis and thecate cyst formation in the armoured dinoflagellates Prorocentrum cordatum.Sci Rep. 2020 Oct 27;10(1):18322. doi: 10.1038/s41598-020-75194-3. Sci Rep. 2020. PMID: 33110141 Free PMC article.
References
-
- Arad SM, Kolani R, Simon-Berkovitch B, Sivan A. Inhibition by DCB of cell wall polysaccharide formation in the red microalga Porphyridium sp. (Rhodophyta) Phycologia. 1994;33:158–162.
-
- Bhaud Y, Salmon JM, Soyer-Gobillard MO. The complex cell cycle of the dinoflagellate protoctist Crypthecodinium cohnii as studied in vivo and by cytofluorimetry. J Cell Sci. 1991;100:675–682.
-
- Buron MI, Garcia-Herdugo G. Experimental analysis of cytokinesis: comparison of inhibition induced by 2,6-dichlorobenzonitrile and caffeine. Protoplasma. 1983;118:192–198.
-
- Cohen A, Arad S. Biosynthesis of the cell-wall polysaccharide in the red microalga Rhodella reticulata. Isr J Plant Sci. 1998;46:144–153.
MeSH terms
Substances
LinkOut - more resources
Full Text Sources

