Clinical Trial
. 2003 Apr;121(4):531-9.
doi: 10.1001/archopht.121.4.531.

Responsiveness of the National Eye Institute Visual Function Questionnaire to changes in visual acuity: findings in patients with subfoveal choroidal neovascularization--SST Report No. 1

Affiliations
Clinical Trial

Responsiveness of the National Eye Institute Visual Function Questionnaire to changes in visual acuity: findings in patients with subfoveal choroidal neovascularization--SST Report No. 1

Päivi H Miskala et al. Arch Ophthalmol. 2003 Apr.

Erratum in

  • Arch Ophthalmol. 2003 Oct;121(10):1513

Abstract

Background: The National Eye Institute Visual Function Questionnaire (NEI-VFQ) measures vision-targeted quality of life, but it is unclear whether it is sensitive to changes within individuals over time.

Objective: To determine the responsiveness of the NEI-VFQ to "within-individual" changes in visual acuity in patients who had subfoveal choroidal neovascularization in at least one eye secondary to age-related macular degeneration, ocular histoplasmosis syndrome, or idiopathic causes, and who participated in randomized trials of submacular surgery.

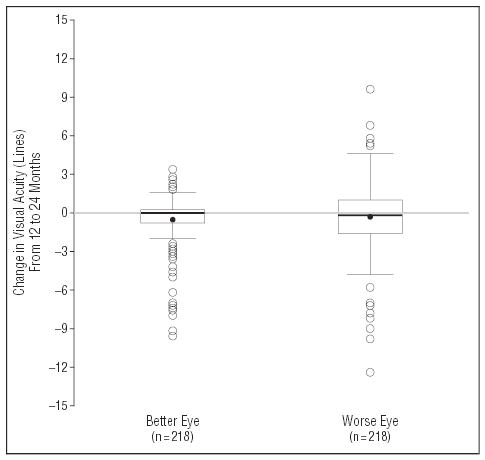
Methods: Trained telephone interviewers administered the NEI-VFQ as part of annual follow-up data collection for pilot trials and larger clinical trials of submacular surgery. Best-corrected visual acuity was measured by local vision examiners at 12 months after enrollment and, typically, by central "traveling" vision examiners at 24 months after enrollment. Changes in visual acuity and NEI-VFQ scores from 12 to 24 months were analyzed using linear regression methods.

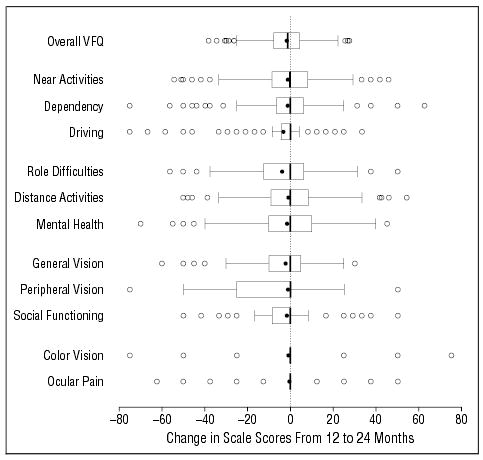
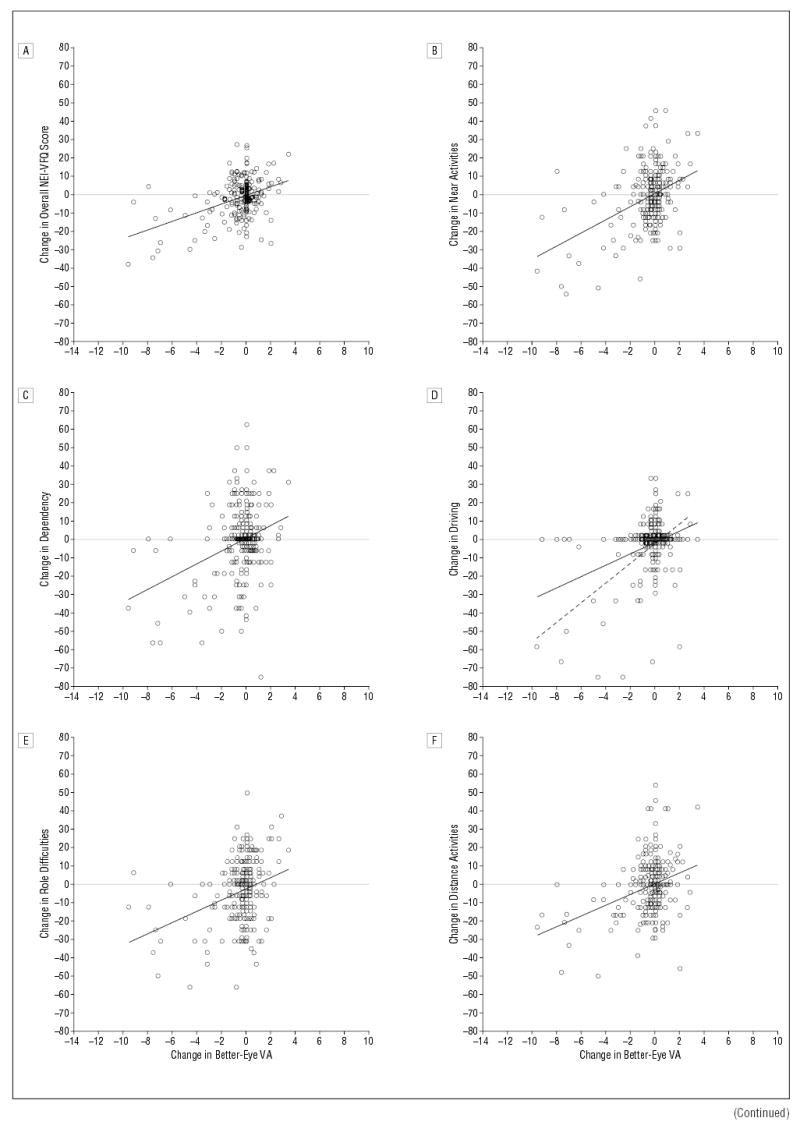
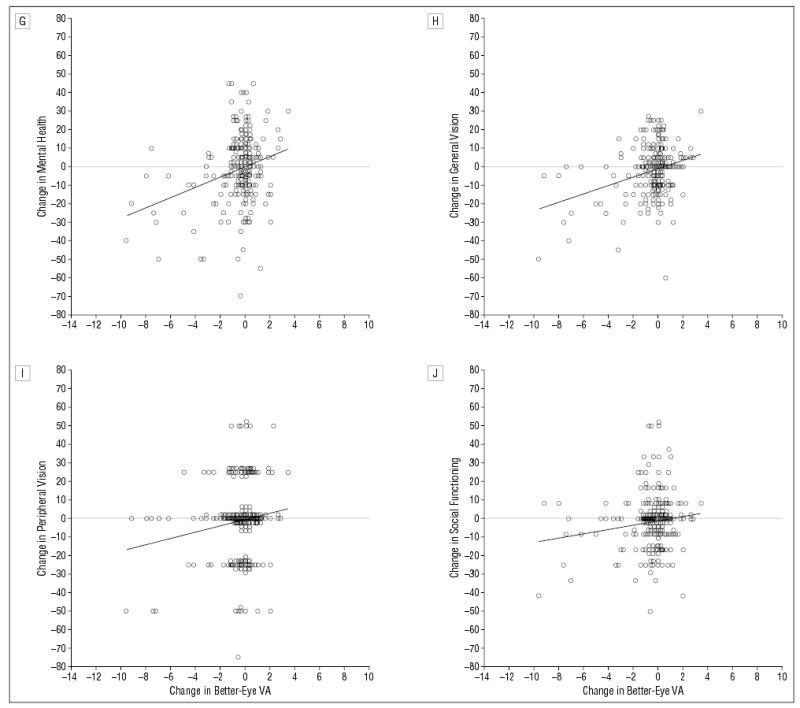
Results: Two-hundred eighteen patients had both interviews and visual acuity measurements at 12 and 24 months after enrollment. Changes in the overall NEI-VFQ score and in 9 of the subscales (near activities, dependency, driving, role difficulties, distance activities, mental health, general vision, peripheral vision, and social functioning) were related to changes in visual acuity of the better-seeing eye based on linear regression analysis (P<.05). In our analysis, a 3-line decrease in the visual acuity of the better-seeing eye was associated with 3.6- to 16.2-point decreases in the overall NEI-VFQ score and 9 subscale scores.

Conclusions: Most of the NEI-VFQ subscales were responsive to changes in the visual acuity of the better-seeing eye over a 12-month interval in this patient population. Thus, the NEI-VFQ can be used to measure change in vision-targeted quality of life over time to augment clinical measurements of visual acuity.


Figures

Figure 1
Figure 1
Box-and-whisker summaries of change in visual acuity from the 12-month to the 24-month examination for the eye with better visual acuity (left box-and-whisker) and for the eye with worse visual acuity (right box-and-whisker) of 218 patients. The solid circles represent the mean value. The horizontal line inside the box is the median, and the bottom and top lines of the box represent 25th and 75th percentiles (quartiles), respectively. Vertical lines (whiskers) represent values within 1.5 times the interquartile range from the central box. Open circles represent outliers.
Figure 2
Figure 2
Box-and-whisker summaries of change in the National Eye Institute Visual Function Questionnaire (NEI-VFQ) overall and subscale scores from the 12-month to the 24-month interview (n=218). The solid circles represent the mean value. The vertical line inside the box is the median, and the left and right vertical lines of the box represent 25th and 75th percentiles (quartiles), respectively. Horizontal lines (whiskers) represent values within 1.5 times the interquartile range from the central box. Open circles represent outliers.
Figure 3
Figure 3
Change in National Eye Institute Visual Function Questionnaire (NEI-VFQ) scores from 12 to 24 months vs change in “better-eye” (ie, better-seeing eye) visual acuity (VA) (in lines) from 12 to 24 months. A horizontal line in each graph separates better (above line) and worse (below line) NEI-VFQ scores. A, Change in overall NEI-VFQ score vs change in better-eye VA (n=218). B, Change in near activities subscale scores vs change in better-eye VA (n=218). C, Change in dependency subscale scores vs change in better-eye VA (n=218). D, Change in driving subscale scores vs change in better-eye VA (n=197). Dashed linear regression line represents association when individuals with a driving score of 0 at 12 and 24 months of follow-up are excluded (n=130). E, Change in role difficulties subscale scores vs change in better-eye VA (n=218). F, Change in distance activities subscale scores vs change in better-eye VA (n=218). G, Change in mental health subscale scores versus change in better-eye VA (n = 218). H, Change in general vision subscale scores vs change in better-eye VA (n = 218). I, Change in peripheral vision subscale scores vs change in better-eye VA (n = 217). J, Change in social functioning subscale scores vs change in better-eye VA (n = 218).
Figure 3
Figure 3
Change in National Eye Institute Visual Function Questionnaire (NEI-VFQ) scores from 12 to 24 months vs change in “better-eye” (ie, better-seeing eye) visual acuity (VA) (in lines) from 12 to 24 months. A horizontal line in each graph separates better (above line) and worse (below line) NEI-VFQ scores. A, Change in overall NEI-VFQ score vs change in better-eye VA (n=218). B, Change in near activities subscale scores vs change in better-eye VA (n=218). C, Change in dependency subscale scores vs change in better-eye VA (n=218). D, Change in driving subscale scores vs change in better-eye VA (n=197). Dashed linear regression line represents association when individuals with a driving score of 0 at 12 and 24 months of follow-up are excluded (n=130). E, Change in role difficulties subscale scores vs change in better-eye VA (n=218). F, Change in distance activities subscale scores vs change in better-eye VA (n=218). G, Change in mental health subscale scores versus change in better-eye VA (n = 218). H, Change in general vision subscale scores vs change in better-eye VA (n = 218). I, Change in peripheral vision subscale scores vs change in better-eye VA (n = 217). J, Change in social functioning subscale scores vs change in better-eye VA (n = 218).

Similar articles

Cited by

References

    1. Mangione CM, Berry S, Spritzer K, et al. Identifying the content area for the 51-item National Eye Institute Visual Function Questionnaire: results from focus groups with visually impaired persons. Arch Ophthalmol. 1998;116:227–233. - PubMed
    1. Mangione CM, Lee PP, Pitts J, et al. Psychometric properties of the National Eye Institute Visual Function Questionnaire (NEI-VFQ) Arch Ophthalmol. 1998;116:1496–1504. - PubMed
    1. Mangione CM, Lee PP, Gutierrez PR, et al. Development of the 25-item National Eye Institute Visual Function Questionnaire. Arch Ophthalmol. 2001;119:1050–1058. - PubMed
    1. Broman AT, Munoz B, West SK, et al. Psychometric properties of the 25-item NEI-VFQ in a Hispanic population: proyecto VER. Invest Ophthalmol Vis Sci. 2001;42:606–613. - PubMed
    1. Cole SR, Beck RW, Moke PS, Gal RL, Long DT the Optic Neuritis Study Group. The National Eye Institute Visual Function Questionnaire: experience of the ONTT. Invest Ophthalmol Vis Sci. 2000;41:1017–1021. - PubMed

Publication types

MeSH terms