. 2003 Apr 14;161(1):131-42.
doi: 10.1083/jcb.200211002.

Synapse formation is regulated by the signaling adaptor GIT1

Affiliations

Synapse formation is regulated by the signaling adaptor GIT1

Huaye Zhang et al. J Cell Biol. .

Abstract

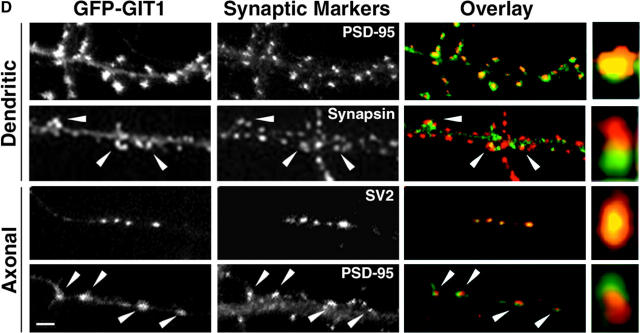
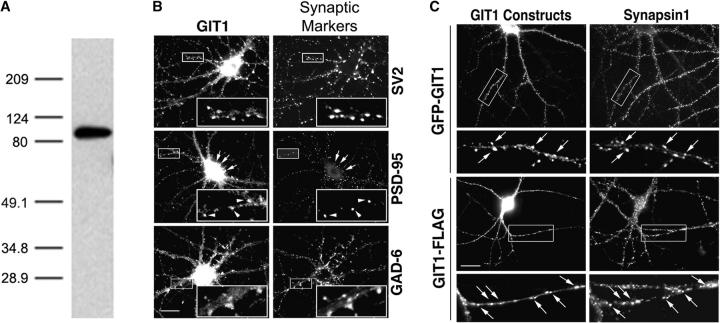
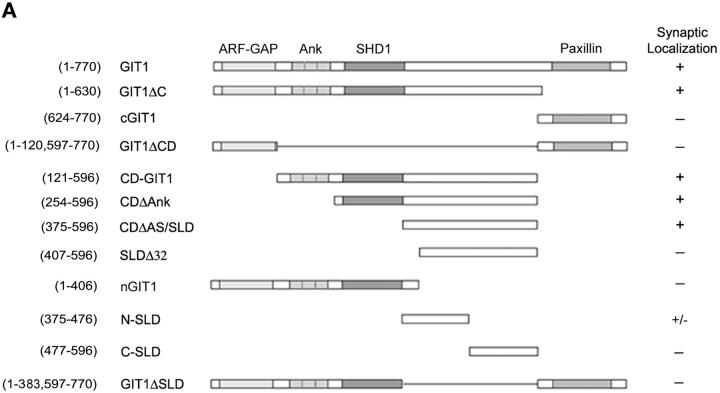
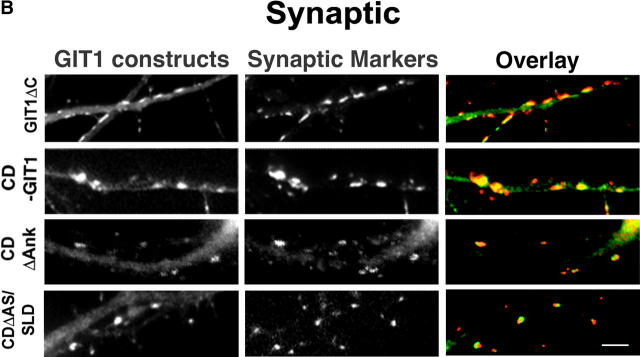
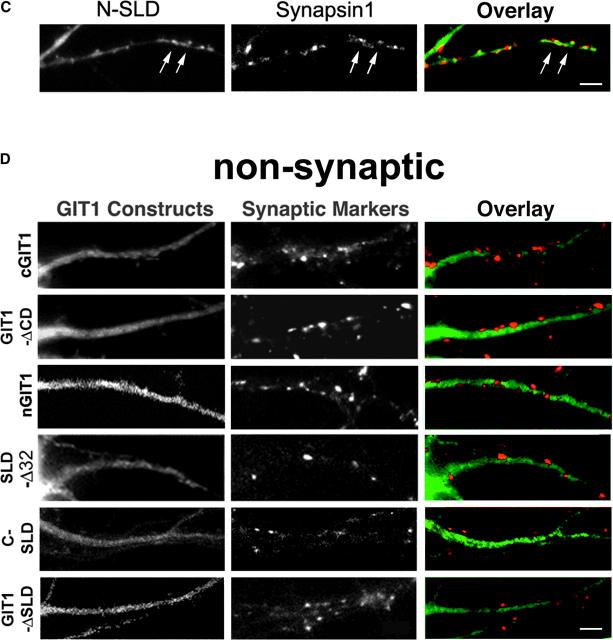
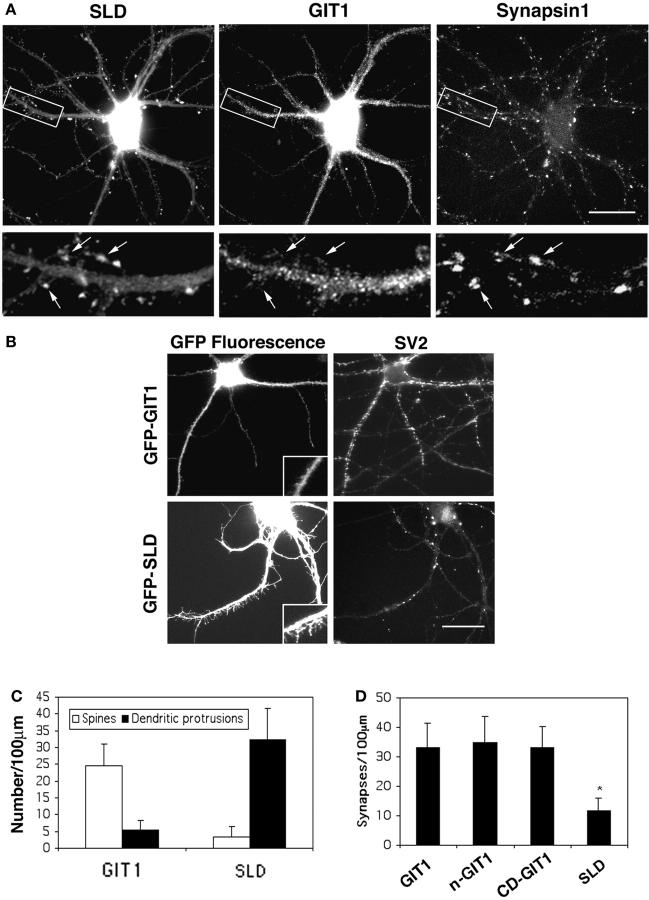
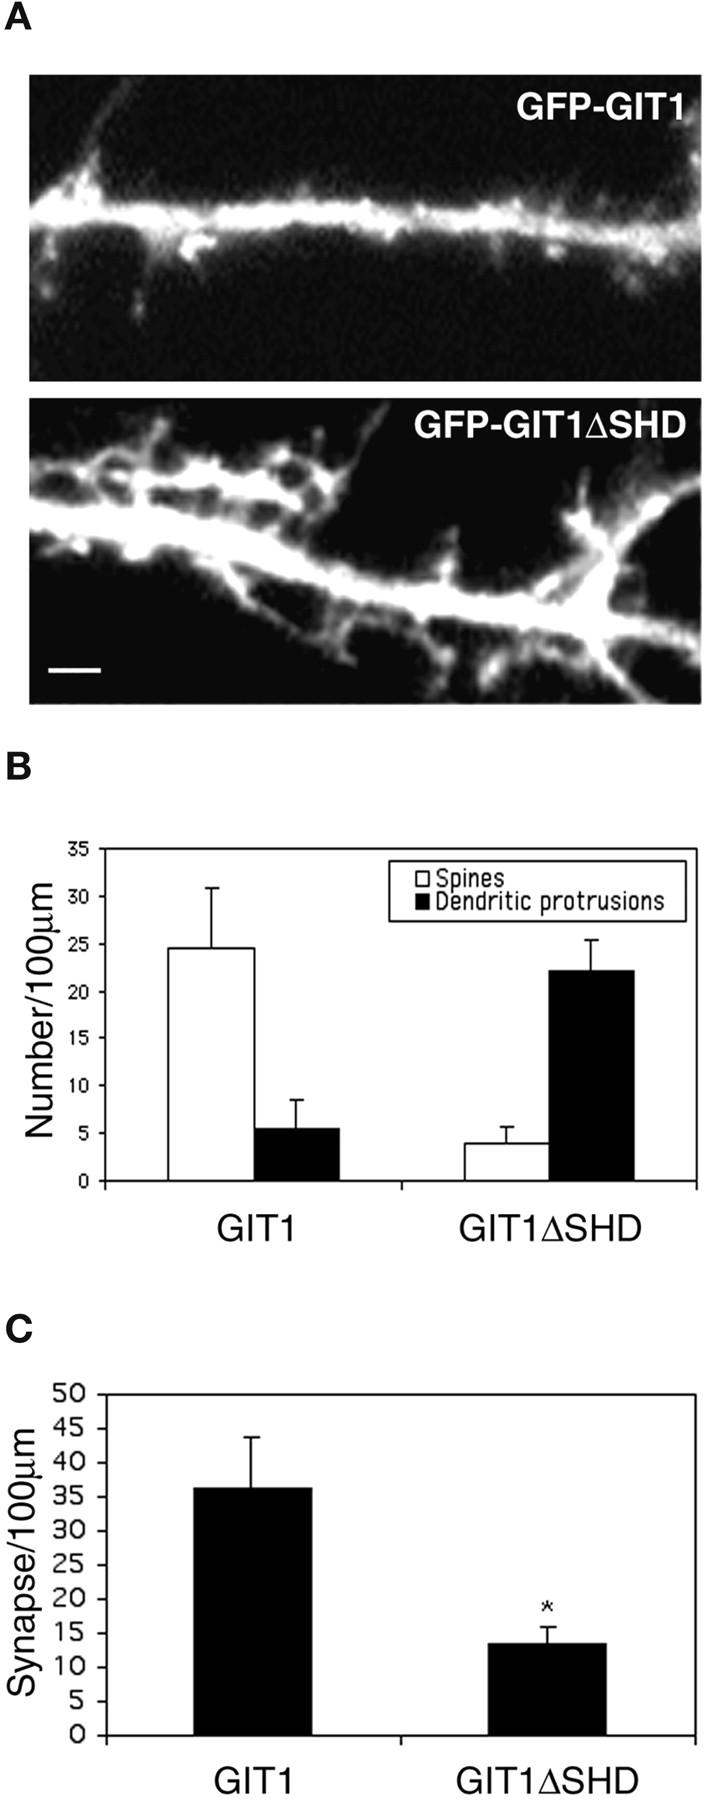
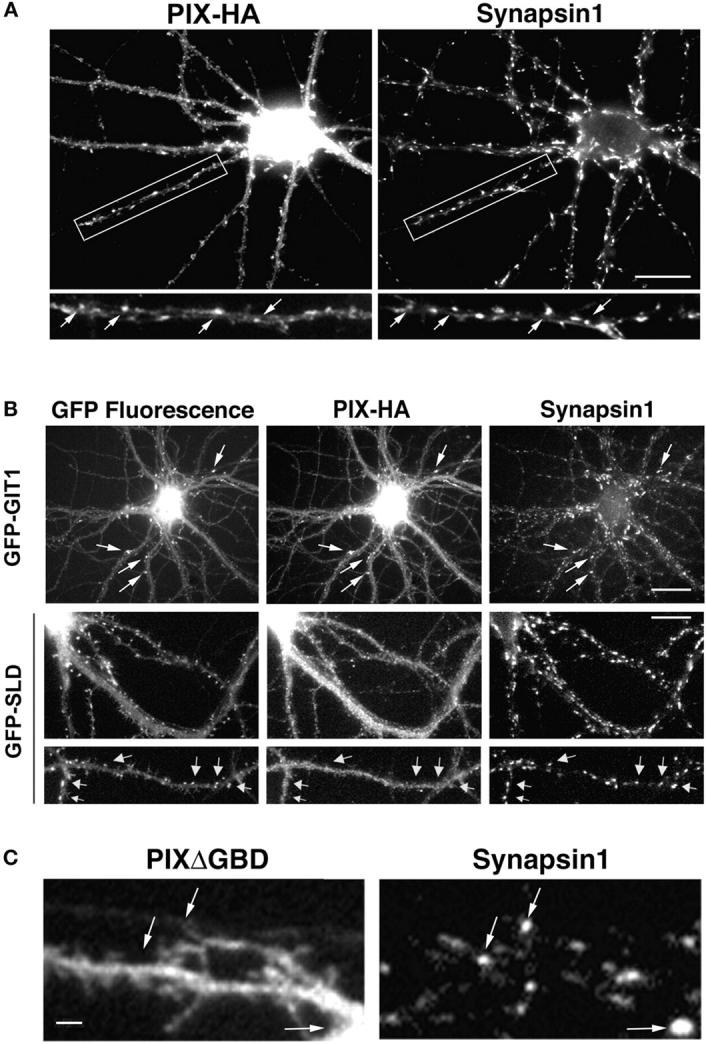
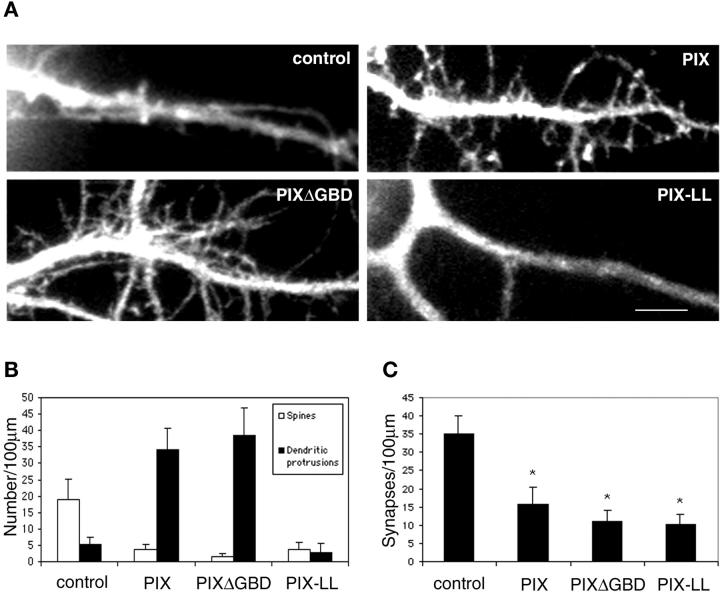
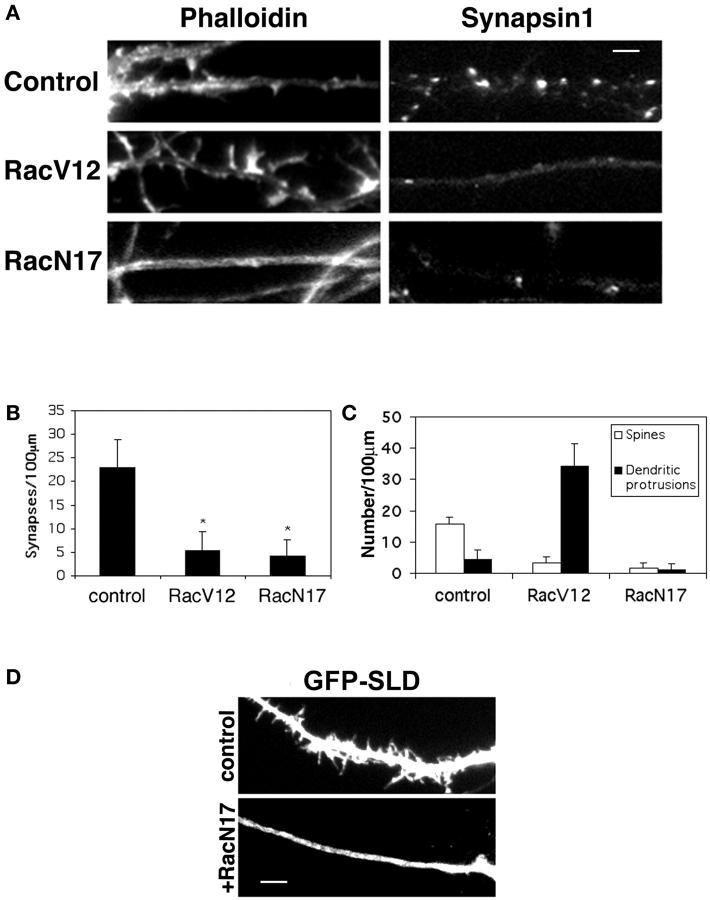
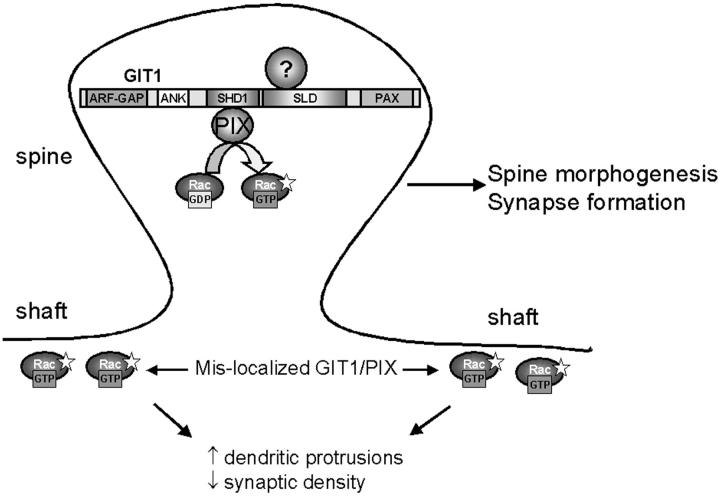
Dendritic spines in the central nervous system undergo rapid actin-based shape changes, making actin regulators potential modulators of spine morphology and synapse formation. Although several potential regulators and effectors for actin organization have been identified, the mechanisms by which these molecules assemble and localize are not understood. Here we show that the G protein-coupled receptor kinase-interacting protein (GIT)1 serves such a function by targeting actin regulators and locally modulating Rac activity at synapses. In cultured hippocampal neurons, GIT1 is enriched in both pre- and postsynaptic terminals and targeted to these sites by a novel domain. Disruption of the synaptic localization of GIT1 by a dominant-negative mutant results in numerous dendritic protrusions and a significant decrease in the number of synapses and normal mushroom-shaped spines. The phenotype results from mislocalized GIT1 and its binding partner PIX, an exchange factor for Rac. In addition, constitutively active Rac shows a phenotype similar to the GIT1 mutant, whereas dominant-negative Rac inhibits the dendritic protrusion formation induced by mislocalized GIT1. These results demonstrate a novel function for GIT1 as a key regulator of spine morphology and synapse formation and point to a potential mechanism by which mutations in Rho family signaling leads to decreased neuronal connectivity and cognitive defects in nonsyndromic mental retardation.


Figures

Figure 1.
Figure 1.
GIT1 is expressed in cultured hippocampal neurons and enriched in synapses. (A) Western blot of a lysate from day 10 cultured hippocampal neurons. The blot was probed with a GIT1 antibody. A specific band at ∼95 kD confirms the presence of the GIT1 protein in these neurons. (B) Hippocampal neurons at 2–3 wk in culture were double immunostained for endogenous GIT1 (left column) and various synaptic proteins (right column). GIT1 colocalizes with the presynaptic marker SV2 (top). GIT1 shows colocalization with PSD-95 in some puncta (arrowheads), but some GIT1 puncta, especially those on the cell body, do not overlap with PSD-95 (middle, arrows). These puncta show colocalization with the inhibitory synapse marker GAD-6 (bottom). Enlargements of the boxed regions are shown in insets at the bottom right of each panel. Bar, 20 μm. (C) Hippocampal neurons were transfected with either GFP-GIT1 (top) or GIT1-FLAG (bottom) and immunostained for the presynaptic marker synapsin1 at 3 wk in culture. Both GFP-GIT1 and GIT1-FLAG colocalize with synapsin1 in dendritic spines and shafts (arrows). Bar, 20 μm. (D) Hippocampal neurons were transfected with GFP-GIT1 and immunostained for the appropriate synaptic markers at 2–3 wk in culture. The GIT1 clusters on the dendrites (Dendritic) almost completely merge with the postsynaptic marker PSD-95 and are in close apposition to the presynaptic marker synapsin1 (Overlay). The GIT1 clusters on the axons (Axonal) completely merge with the presynaptic marker SV2 and are in close apposition to the postsynaptic marker PSD-95 (Overlay). Note the colocalization of GIT1 clusters with the synaptic markers (arrowheads). Enlargements of individual synapses are shown in the right column. GFP-GIT1 is pseudocolored green, and the synaptic markers are pseudocolored red. Bar, 2 μm.
Figure 1.
Figure 1.
GIT1 is expressed in cultured hippocampal neurons and enriched in synapses. (A) Western blot of a lysate from day 10 cultured hippocampal neurons. The blot was probed with a GIT1 antibody. A specific band at ∼95 kD confirms the presence of the GIT1 protein in these neurons. (B) Hippocampal neurons at 2–3 wk in culture were double immunostained for endogenous GIT1 (left column) and various synaptic proteins (right column). GIT1 colocalizes with the presynaptic marker SV2 (top). GIT1 shows colocalization with PSD-95 in some puncta (arrowheads), but some GIT1 puncta, especially those on the cell body, do not overlap with PSD-95 (middle, arrows). These puncta show colocalization with the inhibitory synapse marker GAD-6 (bottom). Enlargements of the boxed regions are shown in insets at the bottom right of each panel. Bar, 20 μm. (C) Hippocampal neurons were transfected with either GFP-GIT1 (top) or GIT1-FLAG (bottom) and immunostained for the presynaptic marker synapsin1 at 3 wk in culture. Both GFP-GIT1 and GIT1-FLAG colocalize with synapsin1 in dendritic spines and shafts (arrows). Bar, 20 μm. (D) Hippocampal neurons were transfected with GFP-GIT1 and immunostained for the appropriate synaptic markers at 2–3 wk in culture. The GIT1 clusters on the dendrites (Dendritic) almost completely merge with the postsynaptic marker PSD-95 and are in close apposition to the presynaptic marker synapsin1 (Overlay). The GIT1 clusters on the axons (Axonal) completely merge with the presynaptic marker SV2 and are in close apposition to the postsynaptic marker PSD-95 (Overlay). Note the colocalization of GIT1 clusters with the synaptic markers (arrowheads). Enlargements of individual synapses are shown in the right column. GFP-GIT1 is pseudocolored green, and the synaptic markers are pseudocolored red. Bar, 2 μm.
Figure 2.
Figure 2.
Synaptic targeting of GIT1. (A) Schematic diagram of the full-length and deletion constructs of GIT1 (all GFP-tagged at the NH2 terminus except N-SLD and C-SLD, which are FLAG-tagged at the NH2 terminus). The indicated domains are as follows: ARF-GAP domain (ARF-GAP), ankyrin repeats (Ank), Spa2 homology domain 1(SHD1), and paxillin binding site (paxillin). The fusion proteins with synaptic localization are indicated with “+”. N-SLD shows weak localization to synapses which is indicated with “+/−”. (B) GIT1 fusion proteins that show specific localization to synapses. Hippocampal neurons were transfected with the various GIT1 fusion proteins (left column) and stained for synaptic markers (middle column). GIT1Δc and CD-GIT1 were coimmunostained for SV2. CDΔAnk was coimmunostained for PSD-95. CDΔAS/SLD was coimmunostained for synapsin1. Overlays are shown in the right column. The GIT1 constructs were pseudocolored green, and the synaptic markers were pseudocolored red. Bar, 2 μm. (C) FLAG–N-SLD– expressing neurons were coimmunostained for FLAG and synapsin1. N-SLD shows partial localization to synapses (arrows). The overlaid picture is shown in the right column. N-SLD was pseudocolored green, and synapsin1 was pseudocolored red. Bar, 2 μm. (D) GIT1 fusion proteins that fail to localize to synapses. Hippocampal neurons expressing the GFP-tagged GIT1 deletion constructs (left column) were stained for SV2 (middle column). The GIT1 constructs lacking SLD (cGIT1, GIT1ΔCD, nGIT1, and GIT1ΔSLD) do not show synaptic localization. Deletion of the NH2-terminal 32 aa of SLD (SLDΔ32) dramatically reduces localization to the synapse. For localization of C-SLD, neurons expressing FLAG–C-SLD were coimmunostained for FLAG and synapsin1. C-SLD shows a diffuse labeling pattern. The overlays are shown in the right column. The GIT1 constructs were pseudocolored green, and the synaptic markers were pseudocolored red. Bar, 2 μm.
Figure 2.
Figure 2.
Synaptic targeting of GIT1. (A) Schematic diagram of the full-length and deletion constructs of GIT1 (all GFP-tagged at the NH2 terminus except N-SLD and C-SLD, which are FLAG-tagged at the NH2 terminus). The indicated domains are as follows: ARF-GAP domain (ARF-GAP), ankyrin repeats (Ank), Spa2 homology domain 1(SHD1), and paxillin binding site (paxillin). The fusion proteins with synaptic localization are indicated with “+”. N-SLD shows weak localization to synapses which is indicated with “+/−”. (B) GIT1 fusion proteins that show specific localization to synapses. Hippocampal neurons were transfected with the various GIT1 fusion proteins (left column) and stained for synaptic markers (middle column). GIT1Δc and CD-GIT1 were coimmunostained for SV2. CDΔAnk was coimmunostained for PSD-95. CDΔAS/SLD was coimmunostained for synapsin1. Overlays are shown in the right column. The GIT1 constructs were pseudocolored green, and the synaptic markers were pseudocolored red. Bar, 2 μm. (C) FLAG–N-SLD– expressing neurons were coimmunostained for FLAG and synapsin1. N-SLD shows partial localization to synapses (arrows). The overlaid picture is shown in the right column. N-SLD was pseudocolored green, and synapsin1 was pseudocolored red. Bar, 2 μm. (D) GIT1 fusion proteins that fail to localize to synapses. Hippocampal neurons expressing the GFP-tagged GIT1 deletion constructs (left column) were stained for SV2 (middle column). The GIT1 constructs lacking SLD (cGIT1, GIT1ΔCD, nGIT1, and GIT1ΔSLD) do not show synaptic localization. Deletion of the NH2-terminal 32 aa of SLD (SLDΔ32) dramatically reduces localization to the synapse. For localization of C-SLD, neurons expressing FLAG–C-SLD were coimmunostained for FLAG and synapsin1. C-SLD shows a diffuse labeling pattern. The overlays are shown in the right column. The GIT1 constructs were pseudocolored green, and the synaptic markers were pseudocolored red. Bar, 2 μm.
Figure 3.
Figure 3.
Overexpression of the SLD from GIT1 regulates spine morphology and synaptic density. (A) Hippocampal neurons were cotransfected with GFP-SLD and GIT1-FLAG and stained for synapsin1. Note the localization of GFP-SLD to the synapses in relatively low expressing cells causes a decreased localization of GIT1 in the synapses (arrows). Bar, 20 μm. (B) Hippocampal neurons were transfected with various GIT1 constructs at 1 wk in culture and stained for SV2 at 2 wk in culture. Note the increase in dendritic protrusions (left column) and the decrease in synaptic density (right column) in neurons expressing high levels of GFP-SLD. Bar, 20 μm. (C) Quantification of the number of spines and dendritic protrusions in hippocampal neurons transfected with either GFP-GIT1 or GFP-SLD. 80–100 dendrites from independent transfections were quantified for each construct. The definitions of spines and dendritic protrusions are provided in Materials and methods. (D) Quantification of synaptic density in hippocampal neurons transfected with GIT1, nGIT1, CD-GIT1, or SLD. 85–110 dendrites from independent transfections were quantified for each construct (as described in Materials and methods). The difference between SLD and other GIT1 constructs was statistically significant as determined by Student's t test (*P < 0.0001). Note that even though nGIT1 contains SHD1, it has a decreased affinity for PIX, as assayed by coimmunoprecipitation, when compared with wild-type GIT1 (Zhao et al., 2000; unpublished data).
Figure 4.
Figure 4.
GIT1ΔSHD-expressing neurons show a phenotype similar to SLD-expressing neurons. (A) Hippocampal neurons were transfected with either GFP-GIT1 or GFP-GIT1ΔSHD at day 7 in culture and imaged at day 14 in culture. Note the increase in dendritic protrusions in GIT1ΔSHD-expressing neurons. Bar, 2 μm. (B) Quantification of the number of spines and dendritic protrusions in GIT1- and GIT1ΔSHD-expressing neurons. (C) Quantification of the synaptic density in GIT1- and GIT1ΔSHD-expressing neurons. The difference between GIT1 and GIT1ΔSHD was statistically significant as determined by Student's t test (*P < 0.0001).
Figure 5.
Figure 5.
PIX is targeted to the synapses by GIT1. (A) HA-tagged βPIX localizes to the synapses. Hippocampal neurons were transfected with βPIX-HA and stained for HA and synapsin1. Arrows indicate PIX puncta that colocalize with synapsin1 puncta. Bar, 20 μm. (B) The localization of PIX to synapses is inhibited by coexpression of GFP-SLD. Hippocampal neurons were cotransfected with either GFP-GIT1 and PIX-HA or GFP-SLD and PIX-HA. They were fixed and stained for HA and synapsin1. Note the localization of PIX in the synapses when coexpressed with GIT1 (arrows, top) and the decreased localization of PIX to synapses when coexpressed with SLD (arrows, bottom). Bar, 20 μm. (C) A GIT1 binding-deficient PIX mutant (PIXΔGBD) does not localized to synapses. Hippocampal neurons were transfected with HA-PIXΔGBD and coimmunostained for HA and synapsin1. Note the lack of localization to synapses with PIXΔGBD (arrows). Bar, 2 μm.
Figure 6.
Figure 6.
Effects of PIX mutants on spine morphology and synaptic density. (A) Hippocampal neurons were transfected with various PIX constructs at day 7 in culture and imaged at day 14 in culture. Note the increase in dendritic protrusions in PIX- and PIXΔGBD- overexpressing neurons and the decrease in spines and dendritic protrusions in PIX-LL–expressing neurons. “Control” denotes GFP-expressing neurons. Bar, 5 μm. (B) Quantification of the number of spines and dendritic protrusions in various PIX constructs. (C) Quantification of the number of synapses in various PIX constructs. The difference between PIX constructs and the untransfected neurons (control) was statistically significant as determined by the Student's t test (*P < 0.0001).
Figure 7.
Figure 7.
Effects of Rac mutants on spine morphology and synaptic density. (A) Effects of Rac mutants on spine morphology and synaptic density. Hippocampal neurons were transfected with myc-tagged RacV12 or RacN17 at day 10 in culture and stained for myc and either rhodamine-conjugated phalloidin (left column) or synapsin1 (right column) at day 12 in culture. Nearby untransfected cells (control) were stained for phalloidin or synapsin1. Note the increase in dendritic protrusions in RacV12-expressing neurons and the decrease in the number of spines in RacN17-expressing neurons. Synaptic density is decreased in both cases. Bar, 2 μm. (B) Quantification of synaptic linear density in neurons transfected with the Rac mutants. Synaptic density is significantly decreased in both RacV12- and RacN17-transfected neurons, *P < 0.0001 (n > 50 for each construct) compared with nearby untransfected neurons (control). (C) Quantification of the number of spines and dendritic protrusions in neurons transfected with the Rac mutants. (D) RacN17 blocks the SLD phenotype. Hippocampal neurons were transfected with either GFP-SLD alone (top) or GFP-SLD and RacN17 (bottom). Note that the dendritic protrusions induced by SLD were completely inhibited by RacN17. Bar, 5 μm.
Figure 8.
Figure 8.
GIT1 regulates synapse formation. GIT1 is targeted to synapses through the SLD. At the synapse, GIT1, or possibly other related molecules, functions as an adaptor protein recruiting exchanges factors, such as PIX, to synapses where they locally activate Rac. Locally regulated Rac activation is essential for spine morphogenesis and synapse formation. When GIT1/PIX is mislocalized from synapses, Rac is activated outside the synaptic area. Mislocalized active Rac is responsible for the increased dendritic protrusions and decreased synaptic density. Inhibition of the Rac signaling pathway results in a decrease in the density of spines and synapses. The indicated domains of GIT1 are as follows: ARF-GAP domain (ARF-GAP), ankyrin repeats (ANK), Spa2 homology domain 1 (SHD1), synaptic localization domain (SLD), and paxillin binding domain (PAX). The question mark indicates the unknown molecule that targets GIT1 to synapses.

Similar articles

Cited by

References

    1. Allen, K.M., J.G. Gleeson, S. Bagrodia, M.W. Partington, J.C. MacMillan, R.A. Cerione, J.C. Mulley, and C.A. Walsh. 1998. PAK3 mutation in nonsyndromic X-linked mental retardation. Nat. Genet. 20:25–30. - PubMed
    1. Barnes, A.P., and S.L. Milgram. 2002. Signals from the X: signal transduction and X-linked mental retardation. Int. J. Dev. Neurosci. 20:397–406. - PubMed
    1. Billuart, P., T. Bienvenu, N. Ronce, V. des Portes, M.C. Vinet, R. Zemni, A. Carrie, C. Beldjord, A. Kahn, C. Moraine, and J. Chelly. 1998. Oligophrenin 1 encodes a rho-GAP protein involved in X-linked mental retardation. Pathol. Biol. (Paris). 46:678. - PubMed
    1. Claing, A., S.J. Perry, M. Achiriloaie, J.K. Walker, J.P. Albanesi, R.J. Lefkowitz, and R.T. Premont. 2000. Multiple endocytic pathways of G protein-coupled receptors delineated by GIT1 sensitivity. Proc. Natl. Acad. Sci. USA. 97:1119–1124. - PMC - PubMed
    1. Craig, A.M., and H. Boudin. 2001. Molecular heterogeneity of central synapses: afferent and target regulation. Nat. Neurosci. 4:569–578. - PubMed

Publication types

MeSH terms